Trade of the Day: AUD/NZD
By: Dima Chernovolov
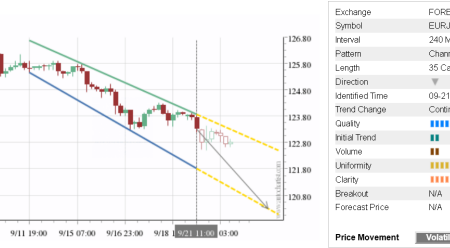
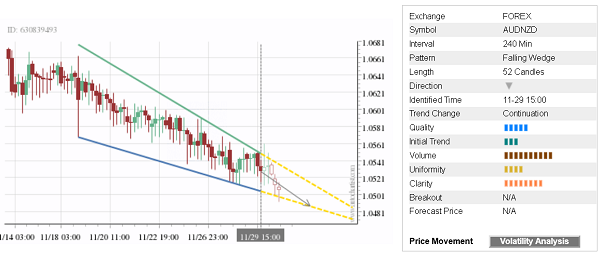
AUD/NZD continues to fall inside the 4-hour Falling Wedge chart pattern which was identified by Autochartist. Autochartist rates the quality of this v Wedge at the 5-bar level – which is the result of the slow Initial Trend (3 bars), below average Uniformity (4 bars) and significant Clarity (7 bars). AUD/NZD is expected to fall further inside this chart pattern – in line with the earlier breakout of the support area shown below.
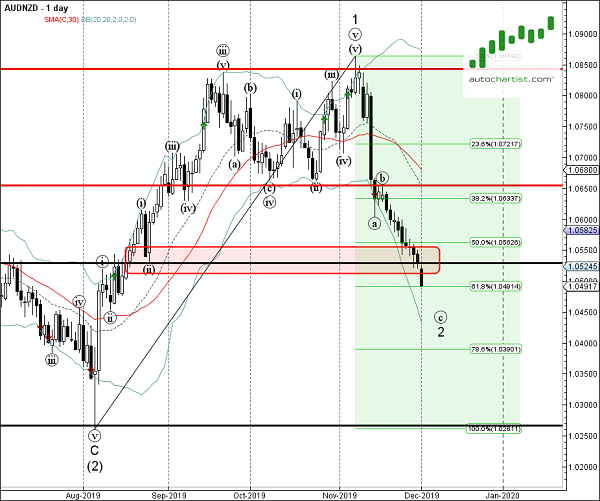
As can be seen from the daily AUD/NZD chart below, the price earlier broke the support area located between the support level 1.0530 and the 50% Fibonacci correction of the previous upward impulse from August. This price area is acting as resistance area after it was broken. The proximity of this resistance area increases the probability AUD/NZD will continue to fall inside this Falling Wedge
.