Trade of the Day: AUD/NZD
By: Dima Chernovolov
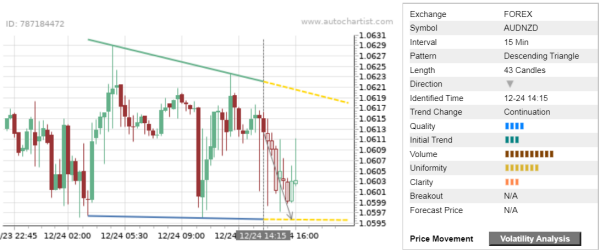
AUD/NZD continues to fall inside the 15-minute Descending Triangle chart pattern, which was previously identified by Autochartist. Autochartist rates the quality of this Descending Triangle at the 4-bar level – which is the result of the slow Initial Trend (3 bars), significant Uniformity (7 bars) and lower Clarity (3 bars). AUD/NZD is expected to fall further inside this Descending Triangle.
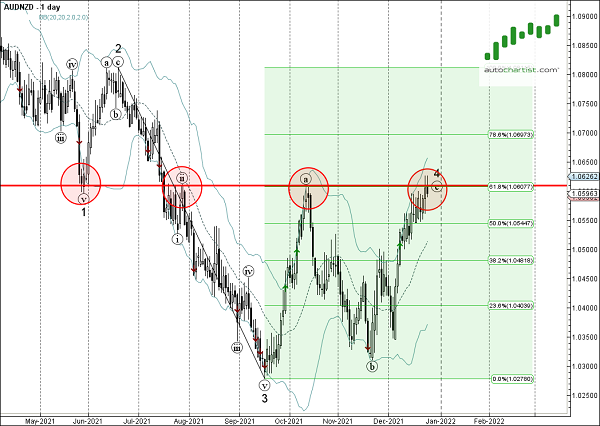
As can be seen from the daily AUD/NZD chart below – the price earlier reversed down from the long-term resistance level 1.0610 (former monthly extremes from May and October respectively) standing near the upper daily Bollinger Band and the 61.8% Fibonacci correction of the downward impulse from June. The proximity of these resistance levels increase the probability AUD/NZD will continue fall inside this Descending Triangle.