The Impact of Timing on Euro Scalping
A few months ago, Jeff from System Trader Success wrote a post where he backtested a version of a Euro Scalping Strategy that Shaun had stumbled across while working on another project. Both Jeff and Shaun believed the scalping strategy had merit, but they also agreed that the strategy would need to be improved in order to be able to overcome the significant transaction costs associated with a scalping strategy that trades five minute bars.
The basic idea behind the strategy was to use a 1% moving average envelope based on the 200-day simple moving average (SMA) as a mean reversion signal. Any time the price broke the price envelope in either direction, the strategy would take a position in the opposite direction and hold until the price broke back into the envelope. Jeff showed that the strategy worked better on the long side, so he excluded the short trades.
In a follow-up post this week, Jeff tested three possible adjustments to the strategy and discussed how they would impact the overall results. What he found was that there was room for slight improvement in adjusting the price envelope and the look-back period of the moving average. This was interesting, but still didn’t make the strategy tradeable.
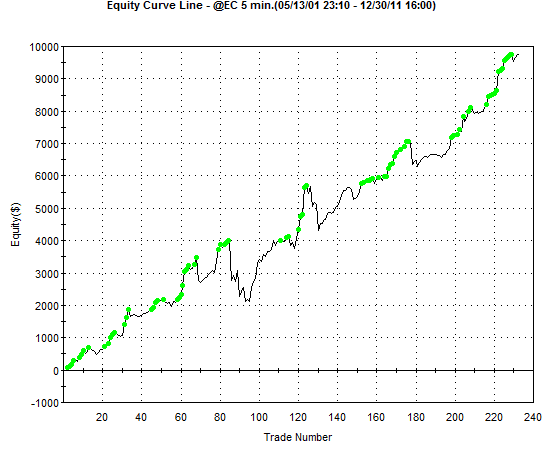
The big improvement came when he limited the time of day that the strategy traded. This simple adjustment took a strategy that was interesting, but not truly profitable, and made it into a strategy with an equity curve that resembles a straight line at a 45 degree angle.

While the timing change was the biggest impact, each of the three adjustments Jeff tested were interesting.
The 1% Price Envelope
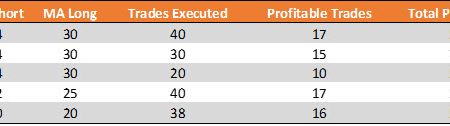
The first adjustment that Jeff tested was changing the 1% price envelope. His data showed that using a price envelope of 1.1% or 1.15% would provide much better returns. He also showed that there was a severe drop in performance in changing the price envelope to 0.95%.
There was also an increase in profit per trade as the price envelope increased. However, that increase was countered by a similar decrease in the number of trade opportunities as the price envelope was increased.
The 200-Day Lookback Period
The next adjustment that Jeff tested was using the 200-day SMA to calculate the price envelopes.
For this adjustment, the data showed that decreasing the lookback period resulted in worse performance. Increasing the lookback period seemed to improve performance, and 290 days seemed to be the optimal lookback period.
As the lookback period increased, Jeff’s data showed that the profit per trade decreased. Because this scalping strategy did not have a large profit per trade to begin with, Jeff decided to stick with the 200-day lookback period.
Limiting Trading Times
The last adjustment Jeff tested was limiting the trading of the strategy to either high or low volatility periods during the day. Becuase the Euro trades heavily during the European and US market opens, Jeff identified 0200 through 1100 as the high volatility period and 1100 through 2300 as the low volatility period.
His backtesting results showed that trading the scalping strategy during the high volatility period resulted in an equity curve that spent most of its time underwater. However, trading exclusively during the low volatility period resulted in a beautiful equity curve.
The strategy’s performance numbers showed that trading during the low volatility period produced almost double the profit factor of trading during the high volatility period.
For his next step in improving this strategy, Jeff plans to perform a thorough walk-forward optimization to see how the strategy will perform on out-of -sample data.