Help & Documentation
  • Home
  • Sign In
  • Contact Us
  • Home
  • Sign In
  • Contact Us

Soybeans up to 896.4411

/Futures Technical Analysis - TD/Soybeans up to 896.4411

Soybeans up to 896.4411

Posted on July 29, 2019 by Autochartist wrote in Futures Technical Analysis - TD.

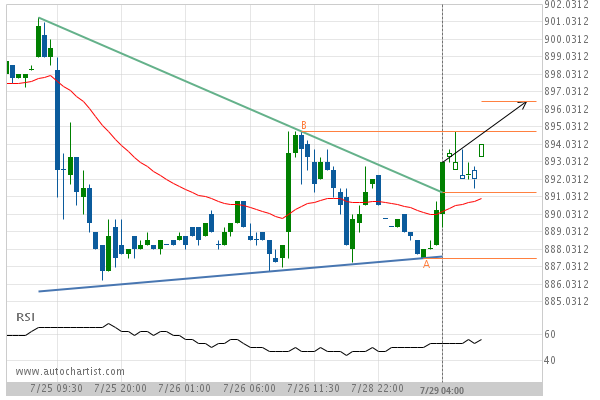
Triangle has broken through the resistance line at 29-Jul-2019 04:00 EDT. Possible bullish price movement forecast for the next 7 hours towards 896.4411.

Tags: CBOT, ZS
0 Likes
725 Views

You may also like

Gold Front Month down to 1310.7994
March 27, 2019
Soybean Oil down to 29.1800
October 10, 2019
Light Sweet Crude Oil Front Month down to 55.5700
March 5, 2019

Comments are closed.

AUD/USD excessive bearish movement Light Sweet Crude Oil Front Month up to 56.6729

Futures Technical Analysis – TD

Light Sweet Crude Oil Front Month up to 67.9800

March 9, 2021 11:17 am | By Autochartist

Rising Wedge identified at 09-Mar-2021 05:00 EST. This pattern is... Read more →

Feeder Cattle Front Month down to 137.2250

March 9, 2021 11:17 am | By Autochartist

Channel Down identified at 08-Mar-2021 14:00 EST. This pattern is... Read more →

Soybean Oil up to 53.2300

March 9, 2021 11:17 am | By Autochartist

Channel Up identified at 09-Mar-2021 04:30 EST. This pattern is... Read more →

Silver Front Month up to 26.5600

March 9, 2021 11:17 am | By Autochartist

Approaching Resistance level of 26.5600 identified at 09-Mar-2021 04:00 EST Read more →

10 year T-Note up to 133.1644

March 9, 2021 11:17 am | By Autochartist

Falling Wedge has broken through the resistance line at 09-Mar-2021... Read more →

  • About Us
  • Privacy Policy
  • Disclaimer
  • Terms and Conditions
  • Get started for FREE
  • Contact Us
Copyright © 2022 Autochartist.com. All rights reserved.
This site uses cookies: Find out more.