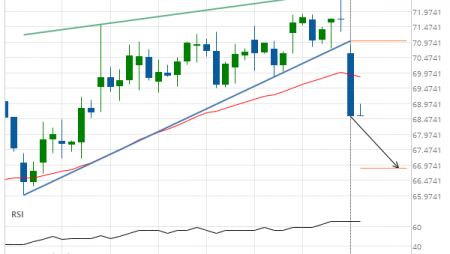
Soybeans up to 856.2500
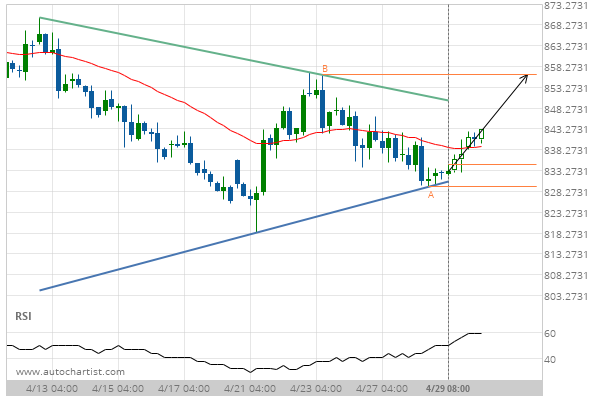
Triangle identified at 29-Apr-2020 08:00 EDT. This pattern is still in the process of forming. Possible bullish price movement towards the resistance 856.2500 within the next 2 days.
Triangle identified at 29-Apr-2020 08:00 EDT. This pattern is still in the process of forming. Possible bullish price movement towards the resistance 856.2500 within the next 2 days.