Help & Documentation
  • Home
  • Sign In
  • Contact Us
  • Home
  • Sign In
  • Contact Us

Soybeans up to 1400.6313

/Futures Technical Analysis - TD/Soybeans up to 1400.6313

Soybeans up to 1400.6313

Posted on February 17, 2021 by Autochartist wrote in Futures Technical Analysis - TD.

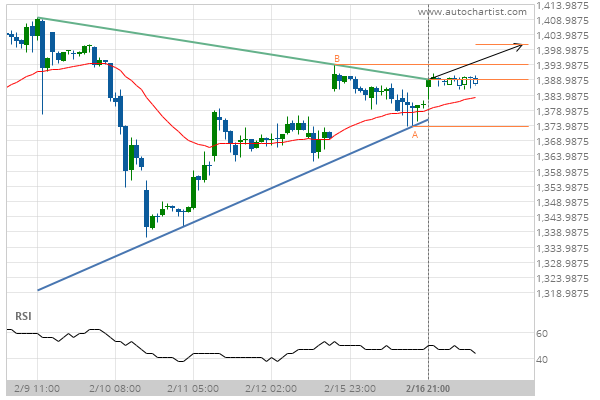
Triangle has broken through the resistance line at 16-Feb-2021 21:00 EST. Possible bullish price movement forecast for the next 15 hours towards 1400.6313.

Tags: CBOT, ZS
0 Likes
379 Views

You may also like

KC HRW Wheat down to 409.7500
August 12, 2020
Corn up to 374.5000
Corn up to 374.5000
August 29, 2019
Soybean Oil down to 29.4800
March 14, 2019

Comments are closed.

CORN MARCH 2021 up to 554.7500 Feeder Cattle Front Month up to 145.3500

Futures Technical Analysis – TD

Light Sweet Crude Oil Front Month up to 67.9800

March 9, 2021 11:17 am | By Autochartist

Rising Wedge identified at 09-Mar-2021 05:00 EST. This pattern is... Read more →

Feeder Cattle Front Month down to 137.2250

March 9, 2021 11:17 am | By Autochartist

Channel Down identified at 08-Mar-2021 14:00 EST. This pattern is... Read more →

Soybean Oil up to 53.2300

March 9, 2021 11:17 am | By Autochartist

Channel Up identified at 09-Mar-2021 04:30 EST. This pattern is... Read more →

Silver Front Month up to 26.5600

March 9, 2021 11:17 am | By Autochartist

Approaching Resistance level of 26.5600 identified at 09-Mar-2021 04:00 EST Read more →

10 year T-Note up to 133.1644

March 9, 2021 11:17 am | By Autochartist

Falling Wedge has broken through the resistance line at 09-Mar-2021... Read more →

  • About Us
  • Privacy Policy
  • Disclaimer
  • Terms and Conditions
  • Get started for FREE
  • Contact Us
Copyright © 2022 Autochartist.com. All rights reserved.
This site uses cookies: Find out more.