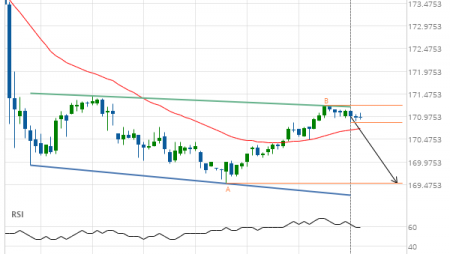
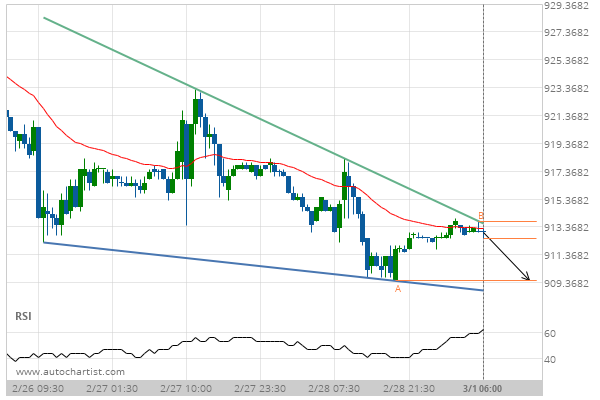
Soybeans down to 909.5000
Falling Wedge identified at 01-Mar-2019 06:00 EST. This pattern is still in the process of forming. Possible bearish price movement towards the support 909.5000 within the next 15 hours.
Falling Wedge identified at 01-Mar-2019 06:00 EST. This pattern is still in the process of forming. Possible bearish price movement towards the support 909.5000 within the next 15 hours.