Help & Documentation
  • Home
  • Sign In
  • Contact Us
  • Home
  • Sign In
  • Contact Us

Soybeans down to 899.0521

/Futures Technical Analysis - TD/Soybeans down to 899.0521

Soybeans down to 899.0521

Posted on August 17, 2020 by Autochartist wrote in Futures Technical Analysis - TD.

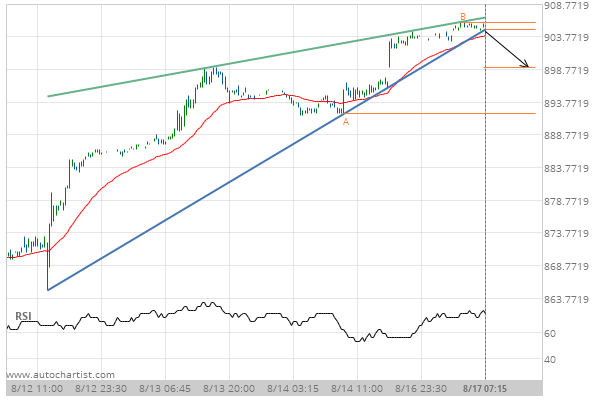
Rising Wedge has broken through the support line at 17-Aug-2020 07:15 EDT. Possible bearish price movement forecast for the next 16 hours towards 899.0521.

Tags: CBOT, ZS
0 Likes
508 Views

You may also like

CORN DECEMBER 2020 down to 365.2500
September 23, 2020
Silver Front Month up to 18.0857
October 9, 2019
Silver Front Month up to 15.9800
May 14, 2020

Comments are closed.

US T-Bond down to 177.6875 Soybean Oil up to 31.8300

Futures Technical Analysis – TD

Light Sweet Crude Oil Front Month up to 67.9800

March 9, 2021 11:17 am | By Autochartist

Rising Wedge identified at 09-Mar-2021 05:00 EST. This pattern is... Read more →

Feeder Cattle Front Month down to 137.2250

March 9, 2021 11:17 am | By Autochartist

Channel Down identified at 08-Mar-2021 14:00 EST. This pattern is... Read more →

Soybean Oil up to 53.2300

March 9, 2021 11:17 am | By Autochartist

Channel Up identified at 09-Mar-2021 04:30 EST. This pattern is... Read more →

Silver Front Month up to 26.5600

March 9, 2021 11:17 am | By Autochartist

Approaching Resistance level of 26.5600 identified at 09-Mar-2021 04:00 EST Read more →

10 year T-Note up to 133.1644

March 9, 2021 11:17 am | By Autochartist

Falling Wedge has broken through the resistance line at 09-Mar-2021... Read more →

  • About Us
  • Privacy Policy
  • Disclaimer
  • Terms and Conditions
  • Get started for FREE
  • Contact Us
Copyright © 2022 Autochartist.com. All rights reserved.
This site uses cookies: Find out more.