Help & Documentation
  • Home
  • Sign In
  • Contact Us
  • Home
  • Sign In
  • Contact Us

Soybeans down to 862.5591

/Futures Technical Analysis - TD/Soybeans down to 862.5591

Soybeans down to 862.5591

Posted on March 9, 2020 by Autochartist wrote in Futures Technical Analysis - TD.

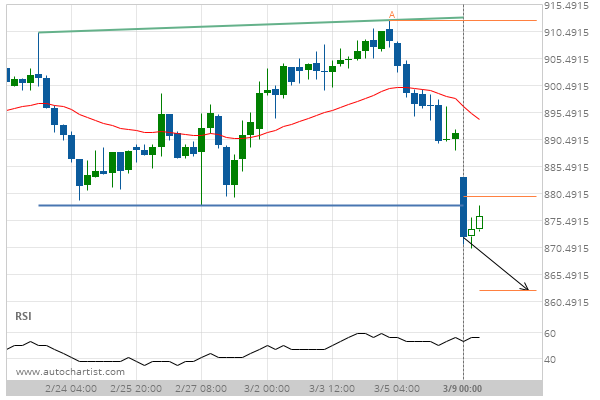
Double Top has broken through the support line at 09-Mar-2020 00:00 EDT. Possible bearish price movement forecast for the next 2 days towards 862.5591.

Tags: CBOT, ZS
0 Likes
620 Views

You may also like

Lean Hogs down to 55.0250
May 6, 2020
Soybeans down to 907.0000
February 22, 2019
10 year T-Note up to 140.1875
July 31, 2020

Comments are closed.

General Electric Co. (GE) excessive bearish movement Silver Front Month down to 16.4960

Futures Technical Analysis – TD

Light Sweet Crude Oil Front Month up to 67.9800

March 9, 2021 11:17 am | By Autochartist

Rising Wedge identified at 09-Mar-2021 05:00 EST. This pattern is... Read more →

Feeder Cattle Front Month down to 137.2250

March 9, 2021 11:17 am | By Autochartist

Channel Down identified at 08-Mar-2021 14:00 EST. This pattern is... Read more →

Soybean Oil up to 53.2300

March 9, 2021 11:17 am | By Autochartist

Channel Up identified at 09-Mar-2021 04:30 EST. This pattern is... Read more →

Silver Front Month up to 26.5600

March 9, 2021 11:17 am | By Autochartist

Approaching Resistance level of 26.5600 identified at 09-Mar-2021 04:00 EST Read more →

10 year T-Note up to 133.1644

March 9, 2021 11:17 am | By Autochartist

Falling Wedge has broken through the resistance line at 09-Mar-2021... Read more →

  • About Us
  • Privacy Policy
  • Disclaimer
  • Terms and Conditions
  • Get started for FREE
  • Contact Us
Copyright © 2022 Autochartist.com. All rights reserved.
This site uses cookies: Find out more.