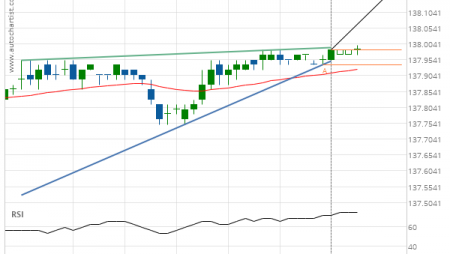
Soybean Oil up to 29.4364
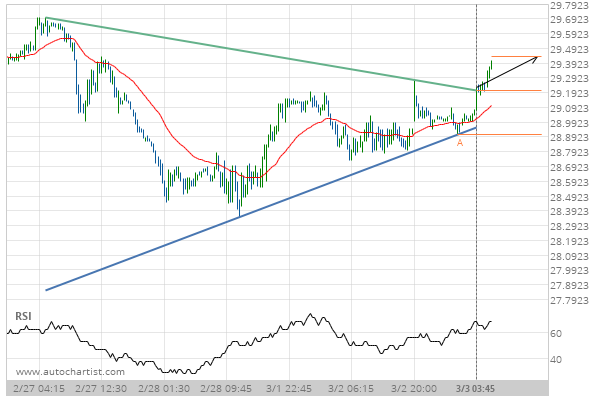
Triangle has broken through the resistance line at 03-Mar-2020 03:45 EST. Possible bullish price movement forecast for the next 16 hours towards 29.4364.
Triangle has broken through the resistance line at 03-Mar-2020 03:45 EST. Possible bullish price movement forecast for the next 16 hours towards 29.4364.