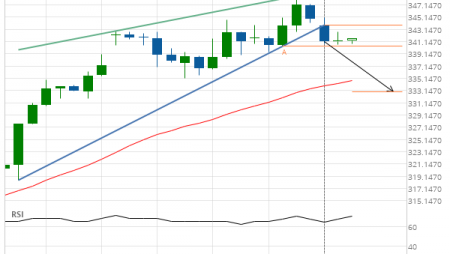
Soybean Oil up to 28.8400
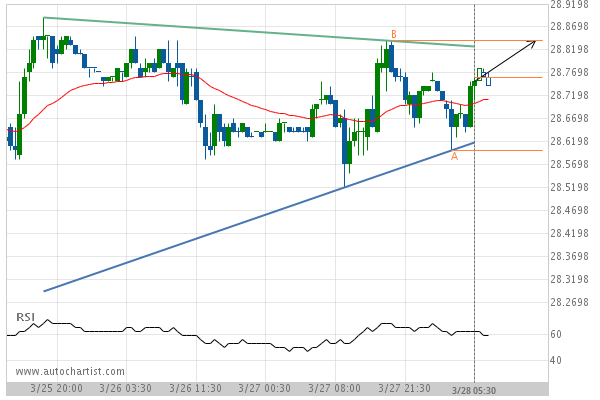
Triangle identified at 28-Mar-2019 05:30 EDT. This pattern is still in the process of forming. Possible bullish price movement towards the resistance 28.8400 within the next 13 hours.
Triangle identified at 28-Mar-2019 05:30 EDT. This pattern is still in the process of forming. Possible bullish price movement towards the resistance 28.8400 within the next 13 hours.