Help & Documentation
  • Home
  • Sign In
  • Contact Us
  • Home
  • Sign In
  • Contact Us

Soybean Oil excessive bearish movement

/Futures Statistical Analysis - TD/Soybean Oil excessive bearish movement

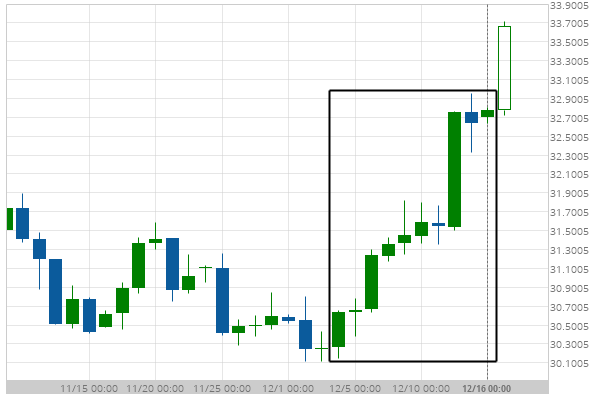
Soybean Oil excessive bearish movement

Posted on December 17, 2019 by Autochartist wrote in Futures Statistical Analysis - TD.

Soybean Oil experienced a 8.29% bullish movement in the last 12 days.

Tags: Big Movement, ZL
0 Likes
737 Views

You may also like

Gold Front Month excessive bearish movement
September 6, 2019
Gold Front Month excessive bearish movement
July 9, 2019
Soybean Oil excessive bearish movement
June 20, 2019

Comments are closed.

KC HRW Wheat excessive bearish movement Trade of the Day: AUD/USD

Futures Statistical Analysis – TD

Soybean Oil excessive bearish movement

March 9, 2021 11:16 am | By Autochartist

Soybean Oil experienced a 19.04% bullish movement in the last... Read more →

Corn excessive bearish movement

March 8, 2021 11:19 am | By Autochartist

Corn experienced a 4.61% bullish movement in the last 73... Read more →

Gold Front Month excessive bearish movement

March 8, 2021 11:19 am | By Autochartist

Gold Front Month experienced a 6.29% bearish movement in the... Read more →

Light Sweet Crude Oil Front Month excessive bearish movement

March 8, 2021 11:19 am | By Autochartist

Light Sweet Crude Oil Front Month experienced a 8.6% bullish... Read more →

10 year T-Note excessive bearish movement

March 8, 2021 11:19 am | By Autochartist

10 year T-Note experienced a 3.4% bearish movement in the... Read more →

  • About Us
  • Privacy Policy
  • Disclaimer
  • Terms and Conditions
  • Get started for FREE
  • Contact Us
Copyright © 2022 Autochartist.com. All rights reserved.
This site uses cookies: Find out more.