Help & Documentation
  • Home
  • Sign In
  • Contact Us
  • Home
  • Sign In
  • Contact Us

Soybean Oil excessive bearish movement

/Futures Statistical Analysis - TD/Soybean Oil excessive bearish movement

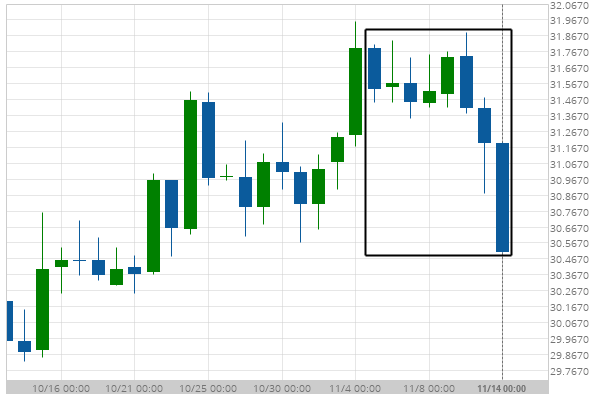
Soybean Oil excessive bearish movement

Posted on November 14, 2019 by Autochartist wrote in Futures Statistical Analysis - TD.

Soybean Oil experienced a 4.03% bearish movement in the last 9 days.

Tags: Big Movement, ZL
0 Likes
678 Views

You may also like

Silver Front Month excessive bearish movement
August 10, 2020
Light Sweet Crude Oil Front Month excessive bearish movement
July 17, 2019
CORN JULY 2019 excessive bearish movement
May 27, 2019

Comments are closed.

Breach of support line imminent by Home Depot Inc. Gold Front Month excessive bearish movement

Futures Statistical Analysis – TD

Soybean Oil excessive bearish movement

March 9, 2021 11:16 am | By Autochartist

Soybean Oil experienced a 19.04% bullish movement in the last... Read more →

Corn excessive bearish movement

March 8, 2021 11:19 am | By Autochartist

Corn experienced a 4.61% bullish movement in the last 73... Read more →

Light Sweet Crude Oil Front Month excessive bearish movement

March 8, 2021 11:19 am | By Autochartist

Light Sweet Crude Oil Front Month experienced a 8.6% bullish... Read more →

Gold Front Month excessive bearish movement

March 8, 2021 11:19 am | By Autochartist

Gold Front Month experienced a 6.29% bearish movement in the... Read more →

10 year T-Note excessive bearish movement

March 8, 2021 11:19 am | By Autochartist

10 year T-Note experienced a 3.4% bearish movement in the... Read more →

  • About Us
  • Privacy Policy
  • Disclaimer
  • Terms and Conditions
  • Get started for FREE
  • Contact Us
Copyright © 2022 Autochartist.com. All rights reserved.
This site uses cookies: Find out more.