Help & Documentation
  • Home
  • Sign In
  • Contact Us
  • Home
  • Sign In
  • Contact Us

Soybean Oil down to 31.0135

/Futures Technical Analysis - TD/Soybean Oil down to 31.0135

Soybean Oil down to 31.0135

Posted on August 4, 2020 by Autochartist wrote in Futures Technical Analysis - TD.

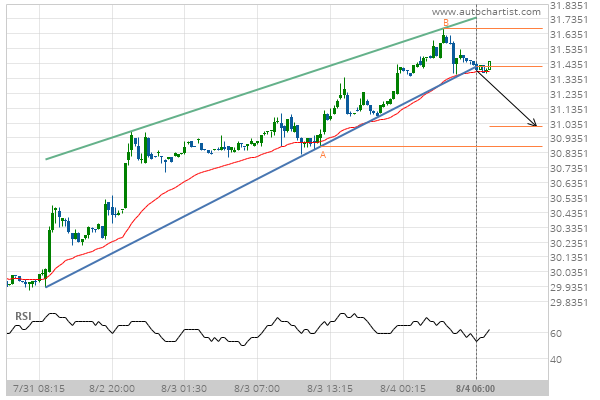
Rising Wedge has broken through the support line at 04-Aug-2020 06:00 EDT. Possible bearish price movement forecast for the next 10 hours towards 31.0135.

Tags: CBOT, ZL
0 Likes
455 Views

You may also like

E-mini S&P 500 up to 2808.0547
March 1, 2019
Silver Front Month up to 15.5899
March 13, 2019
Corn down to 358.5000
May 2, 2019

Comments are closed.

Pfizer Inc. (PFE) excessive bearish movement Lean Hogs down to 47.8750

Futures Technical Analysis – TD

Light Sweet Crude Oil Front Month up to 67.9800

March 9, 2021 11:17 am | By Autochartist

Rising Wedge identified at 09-Mar-2021 05:00 EST. This pattern is... Read more →

Feeder Cattle Front Month down to 137.2250

March 9, 2021 11:17 am | By Autochartist

Channel Down identified at 08-Mar-2021 14:00 EST. This pattern is... Read more →

Soybean Oil up to 53.2300

March 9, 2021 11:17 am | By Autochartist

Channel Up identified at 09-Mar-2021 04:30 EST. This pattern is... Read more →

Silver Front Month up to 26.5600

March 9, 2021 11:17 am | By Autochartist

Approaching Resistance level of 26.5600 identified at 09-Mar-2021 04:00 EST Read more →

10 year T-Note up to 133.1644

March 9, 2021 11:17 am | By Autochartist

Falling Wedge has broken through the resistance line at 09-Mar-2021... Read more →

  • About Us
  • Privacy Policy
  • Disclaimer
  • Terms and Conditions
  • Get started for FREE
  • Contact Us
Copyright © 2022 Autochartist.com. All rights reserved.
This site uses cookies: Find out more.