Help & Documentation
  • Home
  • Sign In
  • Contact Us
  • Home
  • Sign In
  • Contact Us

Soybean Oil down to 27.6000

/Futures Technical Analysis - TD/Soybean Oil down to 27.6000

Soybean Oil down to 27.6000

Posted on August 6, 2019 by Autochartist wrote in Futures Technical Analysis - TD.

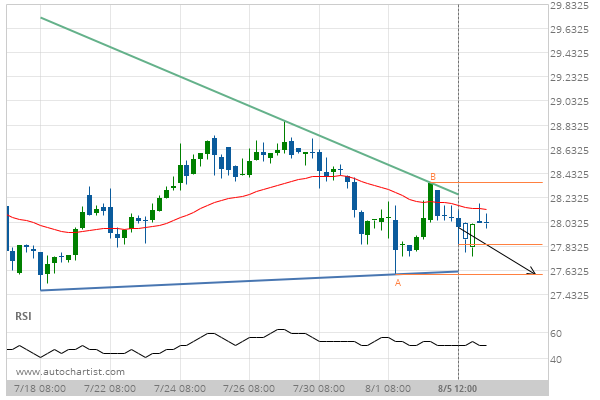
Triangle identified at 05-Aug-2019 12:00 EDT. This pattern is still in the process of forming. Possible bearish price movement towards the support 27.6000 within the next 2 days.

Tags: CBOT, ZL
0 Likes
585 Views

You may also like

Soybeans down to 871.1500
July 9, 2019
Soybeans down to 1337.2500
February 15, 2021
Soybean Oil up to 28.3300
July 23, 2019

Comments are closed.

Gold Front Month up to 1486.7000 USD/CHF excessive bearish movement

Futures Technical Analysis – TD

Light Sweet Crude Oil Front Month up to 67.9800

March 9, 2021 11:17 am | By Autochartist

Rising Wedge identified at 09-Mar-2021 05:00 EST. This pattern is... Read more →

Feeder Cattle Front Month down to 137.2250

March 9, 2021 11:17 am | By Autochartist

Channel Down identified at 08-Mar-2021 14:00 EST. This pattern is... Read more →

Soybean Oil up to 53.2300

March 9, 2021 11:17 am | By Autochartist

Channel Up identified at 09-Mar-2021 04:30 EST. This pattern is... Read more →

Silver Front Month up to 26.5600

March 9, 2021 11:17 am | By Autochartist

Approaching Resistance level of 26.5600 identified at 09-Mar-2021 04:00 EST Read more →

10 year T-Note up to 133.1644

March 9, 2021 11:17 am | By Autochartist

Falling Wedge has broken through the resistance line at 09-Mar-2021... Read more →

  • About Us
  • Privacy Policy
  • Disclaimer
  • Terms and Conditions
  • Get started for FREE
  • Contact Us
Copyright © 2020 Autochartist.com. All rights reserved.
This site uses cookies: Find out more.