Help & Documentation
  • Home
  • Sign In
  • Contact Us
  • Home
  • Sign In
  • Contact Us

Soybean Oil down to 26.6400

/Futures Technical Analysis - TD/Soybean Oil down to 26.6400

Soybean Oil down to 26.6400

Posted on April 15, 2020 by Autochartist wrote in Futures Technical Analysis - TD.

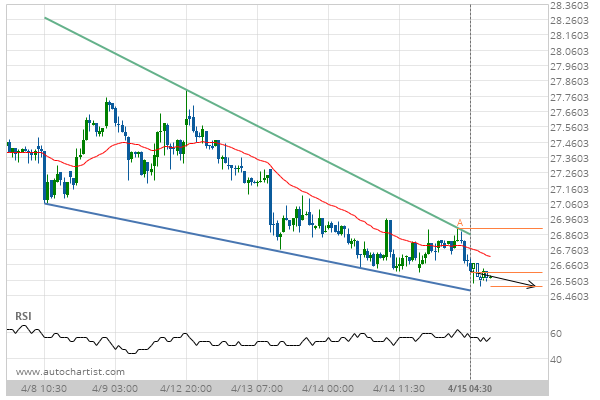
Falling Wedge identified at 15-Apr-2020 04:30 EDT. This pattern is still in the process of forming. Possible bearish price movement towards the support 26.6400 within the next 19 hours.

Tags: CBOT, ZL
0 Likes
599 Views

You may also like

Lean Hogs down to 63.6000
November 17, 2020
Corn down to 371.7500
February 14, 2019
Corn up to 383.7500
Corn up to 383.7500
February 18, 2020

Comments are closed.

Soybeans down to 830.5599 KC HRW Wheat down to 468.3602

Futures Technical Analysis – TD

Light Sweet Crude Oil Front Month up to 67.9800

March 9, 2021 11:17 am | By Autochartist

Rising Wedge identified at 09-Mar-2021 05:00 EST. This pattern is... Read more →

Feeder Cattle Front Month down to 137.2250

March 9, 2021 11:17 am | By Autochartist

Channel Down identified at 08-Mar-2021 14:00 EST. This pattern is... Read more →

Soybean Oil up to 53.2300

March 9, 2021 11:17 am | By Autochartist

Channel Up identified at 09-Mar-2021 04:30 EST. This pattern is... Read more →

Silver Front Month up to 26.5600

March 9, 2021 11:17 am | By Autochartist

Approaching Resistance level of 26.5600 identified at 09-Mar-2021 04:00 EST Read more →

10 year T-Note up to 133.1644

March 9, 2021 11:17 am | By Autochartist

Falling Wedge has broken through the resistance line at 09-Mar-2021... Read more →

  • About Us
  • Privacy Policy
  • Disclaimer
  • Terms and Conditions
  • Get started for FREE
  • Contact Us
Copyright © 2022 Autochartist.com. All rights reserved.
This site uses cookies: Find out more.