Help & Documentation
  • Home
  • Sign In
  • Contact Us
  • Home
  • Sign In
  • Contact Us

Silver Front Month up to 18.5259

/Futures Technical Analysis - TD/Silver Front Month up to 18.5259

Silver Front Month up to 18.5259

Posted on September 6, 2019 by Autochartist wrote in Futures Technical Analysis - TD.

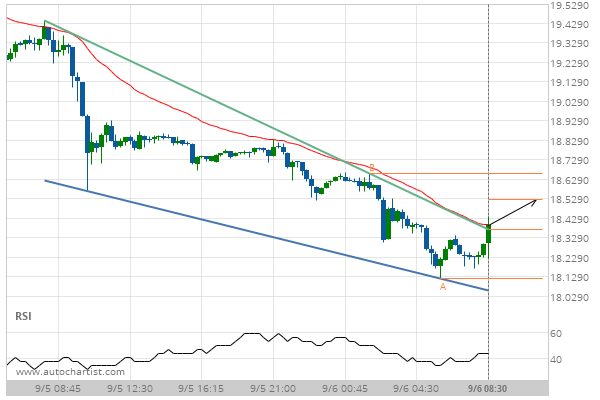
Falling Wedge has broken through the resistance line at 06-Sep-2019 08:30 EDT. Possible bullish price movement forecast for the next 8 hours towards 18.5259.

Tags: COMEX, SI
0 Likes
576 Views

You may also like

US T-Bond down to 167.6322
January 22, 2021
Corn up to 382.7500
Corn up to 382.7500
October 7, 2020
Light Sweet Crude Oil Front Month down to 50.4670
February 24, 2020

Comments are closed.

Soybeans down to 852.5000 Soybean Meal down to 290.1000

Futures Technical Analysis – TD

Light Sweet Crude Oil Front Month up to 67.9800

March 9, 2021 11:17 am | By Autochartist

Rising Wedge identified at 09-Mar-2021 05:00 EST. This pattern is... Read more →

Feeder Cattle Front Month down to 137.2250

March 9, 2021 11:17 am | By Autochartist

Channel Down identified at 08-Mar-2021 14:00 EST. This pattern is... Read more →

Soybean Oil up to 53.2300

March 9, 2021 11:17 am | By Autochartist

Channel Up identified at 09-Mar-2021 04:30 EST. This pattern is... Read more →

Silver Front Month up to 26.5600

March 9, 2021 11:17 am | By Autochartist

Approaching Resistance level of 26.5600 identified at 09-Mar-2021 04:00 EST Read more →

10 year T-Note up to 133.1644

March 9, 2021 11:17 am | By Autochartist

Falling Wedge has broken through the resistance line at 09-Mar-2021... Read more →

  • About Us
  • Privacy Policy
  • Disclaimer
  • Terms and Conditions
  • Get started for FREE
  • Contact Us
Copyright © 2020 Autochartist.com. All rights reserved.
This site uses cookies: Find out more.