Help & Documentation
  • Home
  • Sign In
  • Contact Us
  • Home
  • Sign In
  • Contact Us

Procter & Gamble Co. () down to 125.36

/US Stocks Technical Analysis - TD/Procter & Gamble Co. () down to 125.36

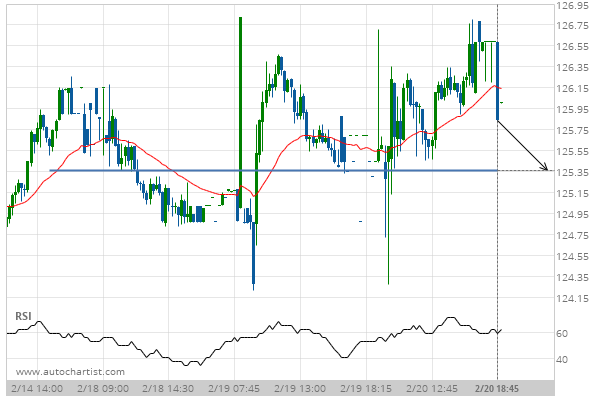
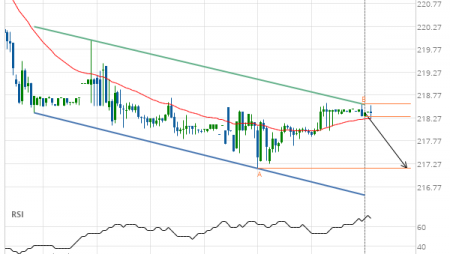
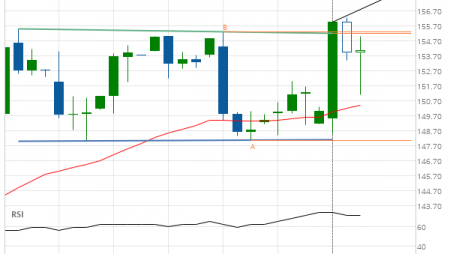
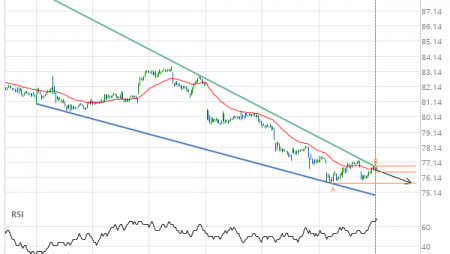
Procter & Gamble Co. () down to 125.36

Posted on February 21, 2020 by Autochartist wrote in US Stocks Technical Analysis - TD.

Approaching Support level of 125.36 identified at 20-Feb-2020 18:45 EST

Tags: PG, Procter & Gamble Co.
0 Likes
520 Views

You may also like

3m Co. (MMM) up to 160.98
June 5, 2020
Exxon Mobil Corp. (XOM) up to 38.57
March 26, 2020
Caterpillar Inc. (CAT) up to 181.26
November 25, 2020

Comments are closed.

Visa (V) down to 203.94 Verizon Communications Inc. () down to 57.91

US Stocks Technical Analysis – TD

Merck & Co. Inc. (MRK) up to 75.56

March 9, 2021 11:13 am | By Autochartist

Rising Wedge identified at 08-Mar-2021 19:30 EST. This pattern is... Read more →

Jpmorgan Chase & Co. (JPM) down to 147.97

March 9, 2021 11:13 am | By Autochartist

Channel Up identified at 08-Mar-2021 19:00 EST. This pattern is... Read more →

Visa (V) down to 215.41

March 9, 2021 11:13 am | By Autochartist

Triangle identified at 08-Mar-2021 20:00 EST. This pattern is still... Read more →

Home Depot Inc. (HD) down to 247.10

March 9, 2021 11:13 am | By Autochartist

Channel Down identified at 08-Mar-2021 16:00 EST. This pattern is... Read more →

Intel Corporation () down to 58.10

March 9, 2021 11:13 am | By Autochartist

Approaching Support level of 58.10 identified at 08-Mar-2021 16:00 EST Read more →

  • About Us
  • Privacy Policy
  • Disclaimer
  • Terms and Conditions
  • Get started for FREE
  • Contact Us
Copyright © 2020 Autochartist.com. All rights reserved.
This site uses cookies: Find out more.