Help & Documentation
  • Home
  • Sign In
  • Contact Us
  • Home
  • Sign In
  • Contact Us

NZD/USD up to 0.6989

/Forex Technical Analysis - TD/NZD/USD up to 0.6989

NZD/USD up to 0.6989

Posted on November 25, 2020 by admin wrote in Forex Technical Analysis - TD.

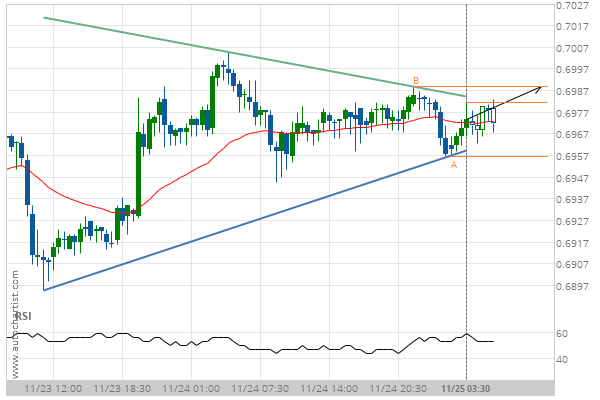
Triangle identified at 25-Nov-2020 03:30 EST. This pattern is still in the process of forming. Possible bullish price movement towards the resistance 0.6989 within the next 11 hours.

Tags: NZDUSD
0 Likes
35 Views

You may also like

GBP/NZD down to 1.9897
March 23, 2020
USD/CHF up to 0.9103
December 2, 2020
GBP/USD up to 1.3710
January 19, 2021

Comments are closed.

USD/CHF up to 0.9148 GBP/JPY down to 138.9792

Forex Technical Analysis – TD

USD/JPY up to 103.9250

January 27, 2021 11:19 am | By admin

Approaching Resistance level of 103.9250 identified at 27-Jan-2021 05:00 EST Read more →

AUD/USD down to 0.7666

January 27, 2021 11:19 am | By admin

Triangle identified at 27-Jan-2021 04:00 EST. This pattern is still... Read more →

EUR/USD up to 1.2190

January 27, 2021 11:19 am | By admin

Triangle identified at 26-Jan-2021 12:00 EST. This pattern is still... Read more →

GBP/USD down to 1.3698

January 27, 2021 11:19 am | By admin

Rising Wedge has broken through the support line at 27-Jan-2021... Read more →

XAU/USD down to 1832.7000

January 27, 2021 11:19 am | By admin

Approaching Support level of 1832.7000 identified at 26-Jan-2021 21:00 EST Read more →

  • About Us
  • Privacy Policy
  • Disclaimer
  • Terms and Conditions
  • Get started for FREE
  • Contact Us
Copyright © 2020 Autochartist.com. All rights reserved.
This site uses cookies: Find out more.