Help & Documentation
  • Home
  • Sign In
  • Contact Us
  • Home
  • Sign In
  • Contact Us

NZD/USD up to 0.6624

/Forex Technical Analysis - TD/NZD/USD up to 0.6624

NZD/USD up to 0.6624

Posted on November 1, 2018 by admin wrote in Forex Technical Analysis - TD.

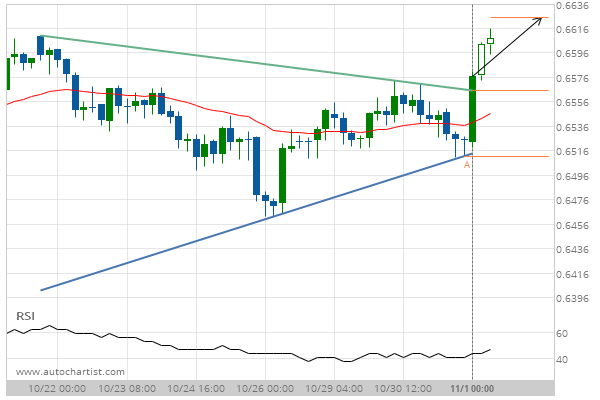
Triangle has broken through the resistance line at 01-Nov-2018 00:00 EDT. Possible bullish price movement forecast for the next 3 days towards 0.6624.

Tags: NZDUSD
0 Likes
131 Views

You may also like

GBP/USD down to 1.3095
September 21, 2018
GBP/JPY down to 141.8400
February 13, 2019
EUR/NZD down to 1.6534
November 30, 2018

Comments are closed.

GBP/NZD down to 1.9334 USD/CHF down to 0.9962

Forex Technical Analysis – TD

USD/CAD down to 1.3273

February 15, 2019 11:15 am | By admin

Approaching Support level of 1.3273 identified at 15-Feb-2019 05:00 EST Read more →

EUR/USD down to 1.1248

February 15, 2019 11:15 am | By admin

Falling Wedge identified at 14-Feb-2019 21:00 EST. This pattern is... Read more →

NZD/USD up to 0.6856

February 15, 2019 11:15 am | By admin

Ascending Triangle identified at 15-Feb-2019 00:00 EST. This pattern is... Read more →

GBP/USD up to 1.2857

February 15, 2019 11:15 am | By admin

Triangle has broken through the resistance line at 15-Feb-2019 05:15... Read more →

USD/JPY down to 109.7998

February 15, 2019 11:15 am | By admin

Channel Up has broken through the support line at 14-Feb-2019... Read more →

  • About Us
  • Privacy Policy
  • Disclaimer
  • Terms and Conditions
  • Get started for FREE
  • Contact Us
Copyright © 2018 Autochartist.com. All rights reserved.
Register

Sign-up


I accept the Privacy Policy, Disclaimer and Conditions of this service

* = Required Field

This site uses cookies: Find out more.