Help & Documentation
  • Home
  • Sign In
  • Contact Us
  • Home
  • Sign In
  • Contact Us

Merck & Co. Inc. () up to 79.96

/US Stocks Technical Analysis - TD/Merck & Co. Inc. () up to 79.96

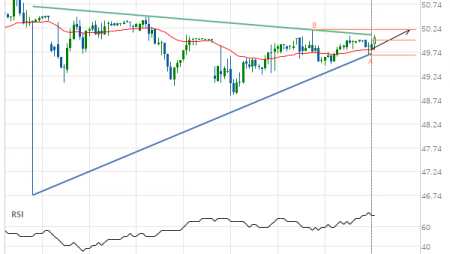
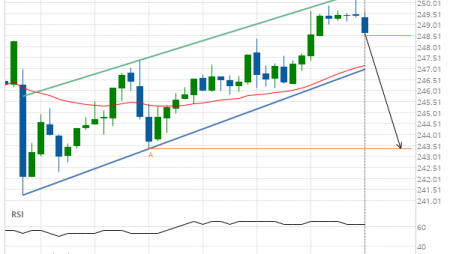
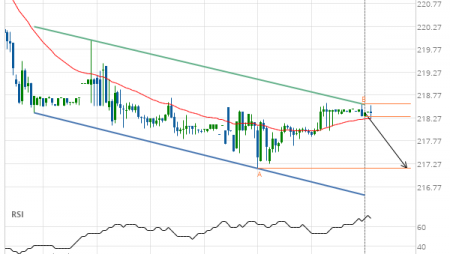
Merck & Co. Inc. () up to 79.96

Posted on February 8, 2019 by Autochartist wrote in US Stocks Technical Analysis - TD.

Broke through Resistance level of 76.70 at 05-Feb-2019 14:30 EST

Tags: Merck & Co. Inc., MRK
0 Likes
936 Views

You may also like

Pfizer Inc. () down to 37.54
May 19, 2020
Nike Inc. Cl B (NKE) up to 89.35
September 13, 2019
Intel Corporation () up to 60.03
July 13, 2020

Comments are closed.

Nike Inc. Cl B (NKE) down to 80.83 10 Yr Us Treasury Note March 2019 Target Level: 121.9688

US Stocks Technical Analysis – TD

Merck & Co. Inc. (MRK) up to 75.56

March 9, 2021 11:13 am | By Autochartist

Rising Wedge identified at 08-Mar-2021 19:30 EST. This pattern is... Read more →

Jpmorgan Chase & Co. (JPM) down to 147.97

March 9, 2021 11:13 am | By Autochartist

Channel Up identified at 08-Mar-2021 19:00 EST. This pattern is... Read more →

Visa (V) down to 215.41

March 9, 2021 11:13 am | By Autochartist

Triangle identified at 08-Mar-2021 20:00 EST. This pattern is still... Read more →

Home Depot Inc. (HD) down to 247.10

March 9, 2021 11:13 am | By Autochartist

Channel Down identified at 08-Mar-2021 16:00 EST. This pattern is... Read more →

Intel Corporation () down to 58.10

March 9, 2021 11:13 am | By Autochartist

Approaching Support level of 58.10 identified at 08-Mar-2021 16:00 EST Read more →

  • About Us
  • Privacy Policy
  • Disclaimer
  • Terms and Conditions
  • Get started for FREE
  • Contact Us
Copyright © 2022 Autochartist.com. All rights reserved.
This site uses cookies: Find out more.