Help & Documentation
  • Home
  • Sign In
  • Contact Us
  • Home
  • Sign In
  • Contact Us

Lean Hogs up to 92.0577

/Futures Technical Analysis - TD/Lean Hogs up to 92.0577

Lean Hogs up to 92.0577

Posted on May 15, 2019 by Autochartist wrote in Futures Technical Analysis - TD.

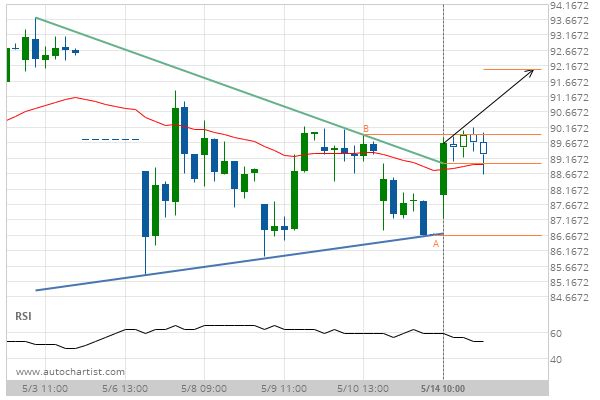
Triangle has broken through the resistance line at 14-May-2019 10:00 EDT. Possible bullish price movement forecast for the next 9 hours towards 92.0577.

Tags: CME, HE
0 Likes
831 Views

You may also like

E-mini S&P 500 down to 2573.1375
January 17, 2019
Soybean Oil down to 30.3800
December 6, 2019
KC HRW Wheat up to 504.2500
January 20, 2020

Comments are closed.

Either a rebound or a breakout imminent on Light Sweet Crude Oil JUNE 2019 Gold Front Month down to 1282.4000

Futures Technical Analysis – TD

Light Sweet Crude Oil Front Month up to 67.9800

March 9, 2021 11:17 am | By Autochartist

Rising Wedge identified at 09-Mar-2021 05:00 EST. This pattern is... Read more →

Feeder Cattle Front Month down to 137.2250

March 9, 2021 11:17 am | By Autochartist

Channel Down identified at 08-Mar-2021 14:00 EST. This pattern is... Read more →

Soybean Oil up to 53.2300

March 9, 2021 11:17 am | By Autochartist

Channel Up identified at 09-Mar-2021 04:30 EST. This pattern is... Read more →

Silver Front Month up to 26.5600

March 9, 2021 11:17 am | By Autochartist

Approaching Resistance level of 26.5600 identified at 09-Mar-2021 04:00 EST Read more →

10 year T-Note up to 133.1644

March 9, 2021 11:17 am | By Autochartist

Falling Wedge has broken through the resistance line at 09-Mar-2021... Read more →

  • About Us
  • Privacy Policy
  • Disclaimer
  • Terms and Conditions
  • Get started for FREE
  • Contact Us
Copyright © 2022 Autochartist.com. All rights reserved.
This site uses cookies: Find out more.