Help & Documentation
  • Home
  • Sign In
  • Contact Us
  • Home
  • Sign In
  • Contact Us

Lean Hogs up to 68.8292

/Futures Technical Analysis - TD/Lean Hogs up to 68.8292

Lean Hogs up to 68.8292

Posted on December 24, 2020 by Autochartist wrote in Futures Technical Analysis - TD.

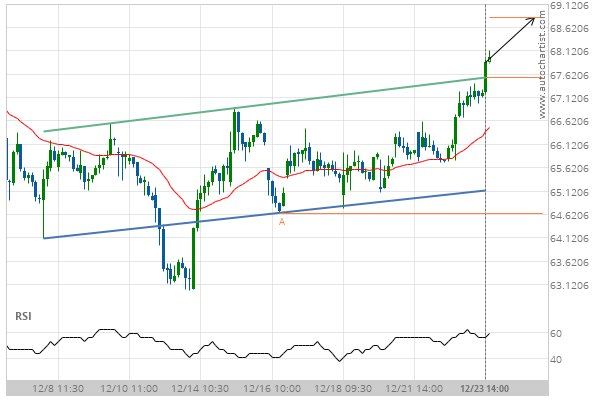
Inverse Head and Shoulders has broken through the resistance line at 23-Dec-2020 14:00 EST. Possible bullish price movement forecast for the next 19 hours towards 68.8292.

Tags: CME, HE
0 Likes
246 Views

You may also like

E-mini S&P 500 down to 2803.7500
May 15, 2020
Lean Hogs up to 68.0000
September 13, 2019
Feeder Cattle Front Month up to 143.4500
June 7, 2019

Comments are closed.

Soybean Oil up to 41.0000 10 year T-Note up to 137.9531

Futures Technical Analysis – TD

Light Sweet Crude Oil Front Month up to 67.9800

March 9, 2021 11:17 am | By Autochartist

Rising Wedge identified at 09-Mar-2021 05:00 EST. This pattern is... Read more →

Feeder Cattle Front Month down to 137.2250

March 9, 2021 11:17 am | By Autochartist

Channel Down identified at 08-Mar-2021 14:00 EST. This pattern is... Read more →

Soybean Oil up to 53.2300

March 9, 2021 11:17 am | By Autochartist

Channel Up identified at 09-Mar-2021 04:30 EST. This pattern is... Read more →

Silver Front Month up to 26.5600

March 9, 2021 11:17 am | By Autochartist

Approaching Resistance level of 26.5600 identified at 09-Mar-2021 04:00 EST Read more →

10 year T-Note up to 133.1644

March 9, 2021 11:17 am | By Autochartist

Falling Wedge has broken through the resistance line at 09-Mar-2021... Read more →

  • About Us
  • Privacy Policy
  • Disclaimer
  • Terms and Conditions
  • Get started for FREE
  • Contact Us
Copyright © 2020 Autochartist.com. All rights reserved.
This site uses cookies: Find out more.