Help & Documentation
  • Home
  • Sign In
  • Contact Us
  • Home
  • Sign In
  • Contact Us

Lean Hogs up to 66.9000

/Futures Technical Analysis - TD/Lean Hogs up to 66.9000

Lean Hogs up to 66.9000

Posted on December 23, 2020 by Autochartist wrote in Futures Technical Analysis - TD.

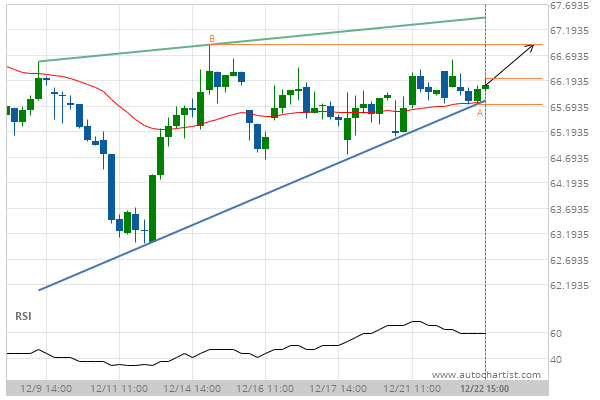
Rising Wedge identified at 22-Dec-2020 15:00 EST. This pattern is still in the process of forming. Possible bullish price movement towards the resistance 66.9000 within the next 18 hours.

Tags: CME, HE
0 Likes
366 Views

You may also like

US T-Bond down to 145.6250
January 10, 2019
US T-Bond up to 181.3906
July 22, 2020
Soybean Meal down to 295.1000
August 22, 2019

Comments are closed.

KC HRW Wheat up to 581.5000 USD/CHF up to 0.8905

Futures Technical Analysis – TD

Light Sweet Crude Oil Front Month up to 67.9800

March 9, 2021 11:17 am | By Autochartist

Rising Wedge identified at 09-Mar-2021 05:00 EST. This pattern is... Read more →

Feeder Cattle Front Month down to 137.2250

March 9, 2021 11:17 am | By Autochartist

Channel Down identified at 08-Mar-2021 14:00 EST. This pattern is... Read more →

Soybean Oil up to 53.2300

March 9, 2021 11:17 am | By Autochartist

Channel Up identified at 09-Mar-2021 04:30 EST. This pattern is... Read more →

Silver Front Month up to 26.5600

March 9, 2021 11:17 am | By Autochartist

Approaching Resistance level of 26.5600 identified at 09-Mar-2021 04:00 EST Read more →

10 year T-Note up to 133.1644

March 9, 2021 11:17 am | By Autochartist

Falling Wedge has broken through the resistance line at 09-Mar-2021... Read more →

  • About Us
  • Privacy Policy
  • Disclaimer
  • Terms and Conditions
  • Get started for FREE
  • Contact Us
Copyright © 2022 Autochartist.com. All rights reserved.
This site uses cookies: Find out more.