Help & Documentation
  • Home
  • Sign In
  • Contact Us
  • Home
  • Sign In
  • Contact Us

Lean Hogs excessive bearish movement

/Futures Statistical Analysis - TD/Lean Hogs excessive bearish movement

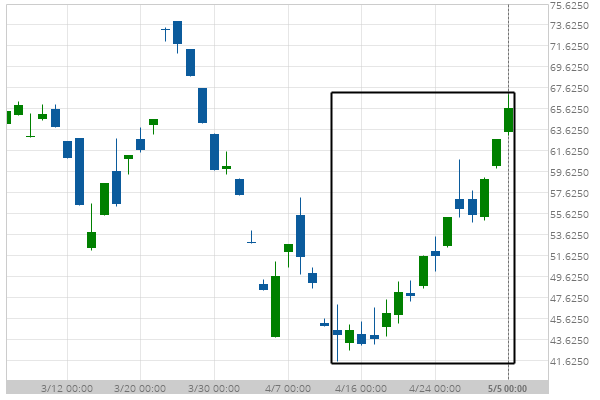
Lean Hogs excessive bearish movement

Posted on May 5, 2020 by Autochartist wrote in Futures Statistical Analysis - TD.

Lean Hogs experienced a 49.29% bullish movement in the last 21 days.

Tags: Big Movement, HE
0 Likes
382 Views

You may also like

E-mini S&P 500 excessive bearish movement
June 12, 2020
KC HRW Wheat excessive bearish movement
January 17, 2019
Silver Front Month excessive bearish movement
August 12, 2020

Comments are closed.

Home Depot Inc. (HD) excessive bearish movement Feeder Cattle Front Month excessive bearish movement

Futures Statistical Analysis – TD

Soybean Oil excessive bearish movement

March 9, 2021 11:16 am | By Autochartist

Soybean Oil experienced a 19.04% bullish movement in the last... Read more →

Corn excessive bearish movement

March 8, 2021 11:19 am | By Autochartist

Corn experienced a 4.61% bullish movement in the last 73... Read more →

Gold Front Month excessive bearish movement

March 8, 2021 11:19 am | By Autochartist

Gold Front Month experienced a 6.29% bearish movement in the... Read more →

Light Sweet Crude Oil Front Month excessive bearish movement

March 8, 2021 11:19 am | By Autochartist

Light Sweet Crude Oil Front Month experienced a 8.6% bullish... Read more →

10 year T-Note excessive bearish movement

March 8, 2021 11:19 am | By Autochartist

10 year T-Note experienced a 3.4% bearish movement in the... Read more →

  • About Us
  • Privacy Policy
  • Disclaimer
  • Terms and Conditions
  • Get started for FREE
  • Contact Us
Copyright © 2020 Autochartist.com. All rights reserved.
This site uses cookies: Find out more.