Help & Documentation
  • Home
  • Sign In
  • Contact Us
  • Home
  • Sign In
  • Contact Us

Lean Hogs down to 66.8638

/Futures Technical Analysis - TD/Lean Hogs down to 66.8638

Lean Hogs down to 66.8638

Posted on January 6, 2020 by Autochartist wrote in Futures Technical Analysis - TD.

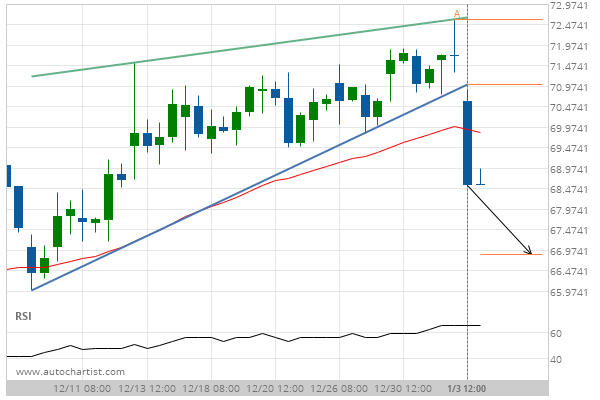
Rising Wedge has broken through the support line at 03-Jan-2020 12:00 EST. Possible bearish price movement forecast for the next 2 days towards 66.8638.

Tags: CME, HE
0 Likes
647 Views

You may also like

Soybean Oil down to 30.4100
February 19, 2020
Soybeans down to 1176.7500
November 23, 2020
10 year T-Note up to 139.4375
April 20, 2020

Comments are closed.

Intel Corporation () down to 59.35 Light Sweet Crude Oil Front Month down to 62.2200

Futures Technical Analysis – TD

Light Sweet Crude Oil Front Month up to 67.9800

March 9, 2021 11:17 am | By Autochartist

Rising Wedge identified at 09-Mar-2021 05:00 EST. This pattern is... Read more →

Feeder Cattle Front Month down to 137.2250

March 9, 2021 11:17 am | By Autochartist

Channel Down identified at 08-Mar-2021 14:00 EST. This pattern is... Read more →

Soybean Oil up to 53.2300

March 9, 2021 11:17 am | By Autochartist

Channel Up identified at 09-Mar-2021 04:30 EST. This pattern is... Read more →

Silver Front Month up to 26.5600

March 9, 2021 11:17 am | By Autochartist

Approaching Resistance level of 26.5600 identified at 09-Mar-2021 04:00 EST Read more →

10 year T-Note up to 133.1644

March 9, 2021 11:17 am | By Autochartist

Falling Wedge has broken through the resistance line at 09-Mar-2021... Read more →

  • About Us
  • Privacy Policy
  • Disclaimer
  • Terms and Conditions
  • Get started for FREE
  • Contact Us
Copyright © 2022 Autochartist.com. All rights reserved.
This site uses cookies: Find out more.