Help & Documentation
  • Home
  • Sign In
  • Contact Us
  • Home
  • Sign In
  • Contact Us

Lean Hogs down to 59.5570

/Futures Technical Analysis - TD/Lean Hogs down to 59.5570

Lean Hogs down to 59.5570

Posted on September 23, 2019 by Autochartist wrote in Futures Technical Analysis - TD.

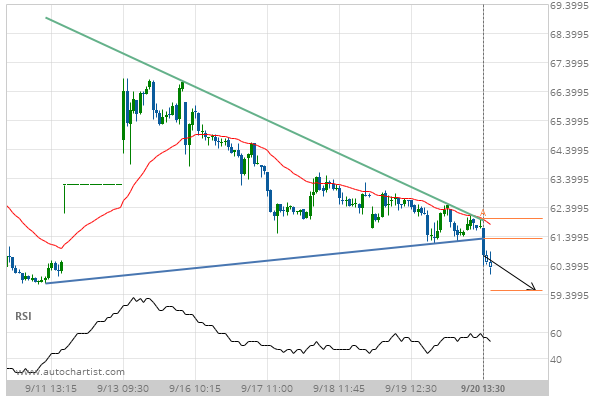
Triangle has broken through the support line at 20-Sep-2019 13:30 EDT. Possible bearish price movement forecast for the next 11 hours towards 59.5570.

Tags: CME, HE
0 Likes
609 Views

You may also like

Silver Front Month up to 15.5550
June 25, 2019
US T-Bond up to 175.9375
June 8, 2020
Light Sweet Crude Oil Front Month up to 41.4700
October 14, 2020

Comments are closed.

Feeder Cattle Front Month down to 132.8750 General Electric Co. (GE) down to 9.18

Futures Technical Analysis – TD

Light Sweet Crude Oil Front Month up to 67.9800

March 9, 2021 11:17 am | By Autochartist

Rising Wedge identified at 09-Mar-2021 05:00 EST. This pattern is... Read more →

Feeder Cattle Front Month down to 137.2250

March 9, 2021 11:17 am | By Autochartist

Channel Down identified at 08-Mar-2021 14:00 EST. This pattern is... Read more →

Soybean Oil up to 53.2300

March 9, 2021 11:17 am | By Autochartist

Channel Up identified at 09-Mar-2021 04:30 EST. This pattern is... Read more →

Silver Front Month up to 26.5600

March 9, 2021 11:17 am | By Autochartist

Approaching Resistance level of 26.5600 identified at 09-Mar-2021 04:00 EST Read more →

10 year T-Note up to 133.1644

March 9, 2021 11:17 am | By Autochartist

Falling Wedge has broken through the resistance line at 09-Mar-2021... Read more →

  • About Us
  • Privacy Policy
  • Disclaimer
  • Terms and Conditions
  • Get started for FREE
  • Contact Us
Copyright © 2022 Autochartist.com. All rights reserved.
This site uses cookies: Find out more.