Help & Documentation
  • Home
  • Sign In
  • Contact Us
  • Home
  • Sign In
  • Contact Us

KC HRW Wheat up to 422.2093

/Futures Technical Analysis - TD/KC HRW Wheat up to 422.2093

KC HRW Wheat up to 422.2093

Posted on August 8, 2019 by Autochartist wrote in Futures Technical Analysis - TD.

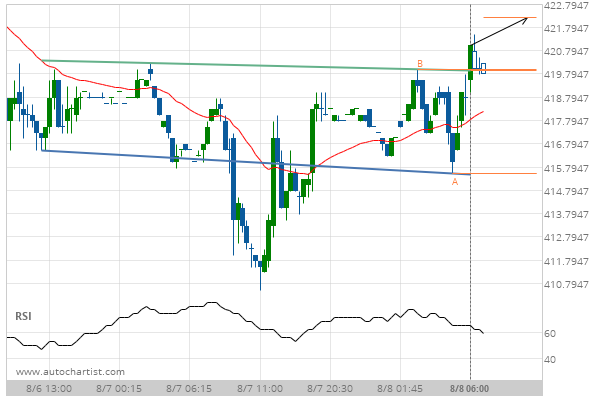
Inverse Head and Shoulders has broken through the resistance line at 08-Aug-2019 06:00 EDT. Possible bullish price movement forecast for the next 8 hours towards 422.2093.

Tags: CBOT, KE
0 Likes
799 Views

You may also like

Gold Front Month up to 1218.0000
September 14, 2018
US T-Bond up to 177.0000
October 15, 2020
KC HRW Wheat down to 469.7500
April 6, 2020

Comments are closed.

Lean Hogs excessive bearish movement 10 year T-Note up to 130.8594

Futures Technical Analysis – TD

Light Sweet Crude Oil Front Month up to 67.9800

March 9, 2021 11:17 am | By Autochartist

Rising Wedge identified at 09-Mar-2021 05:00 EST. This pattern is... Read more →

Feeder Cattle Front Month down to 137.2250

March 9, 2021 11:17 am | By Autochartist

Channel Down identified at 08-Mar-2021 14:00 EST. This pattern is... Read more →

Soybean Oil up to 53.2300

March 9, 2021 11:17 am | By Autochartist

Channel Up identified at 09-Mar-2021 04:30 EST. This pattern is... Read more →

Silver Front Month up to 26.5600

March 9, 2021 11:17 am | By Autochartist

Approaching Resistance level of 26.5600 identified at 09-Mar-2021 04:00 EST Read more →

10 year T-Note up to 133.1644

March 9, 2021 11:17 am | By Autochartist

Falling Wedge has broken through the resistance line at 09-Mar-2021... Read more →

  • About Us
  • Privacy Policy
  • Disclaimer
  • Terms and Conditions
  • Get started for FREE
  • Contact Us
Copyright © 2022 Autochartist.com. All rights reserved.
This site uses cookies: Find out more.