KC HRW Wheat MAY 2019 Target Level: 422.0000
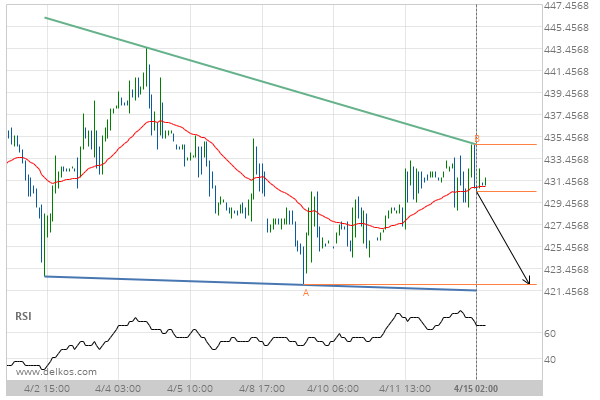
Descending Triangle identified at 15-Apr-2019 02:00 UTC. This pattern is still in the process of forming. Possible bearish price movement towards the support 422.0000 within the next 3 days.
Did you know that our social media feeds are updated only 3x per day, and don’t look at short term movements?
If you open a live account with a broker that support Autochartist, you’ll get:
Analysis as low as 15 minute data intervals Short term forecasts Risk and volatility information