Help & Documentation
  • Home
  • Sign In
  • Contact Us
  • Home
  • Sign In
  • Contact Us

KC HRW Wheat down to 543.3885

/Futures Technical Analysis - TD/KC HRW Wheat down to 543.3885

KC HRW Wheat down to 543.3885

Posted on October 26, 2020 by Autochartist wrote in Futures Technical Analysis - TD.

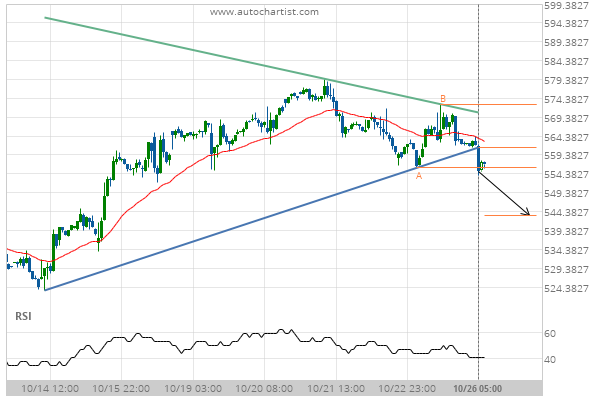
Triangle has broken through the support line at 26-Oct-2020 05:00 EDT. Possible bearish price movement forecast for the next 2 days towards 543.3885.

Tags: CBOT, KE
0 Likes
459 Views

You may also like

Gold Front Month up to 1754.9000
June 17, 2020
Lean Hogs down to 47.8750
August 19, 2020
Soybean Meal up to 285.0000
August 11, 2020

Comments are closed.

Soybean Oil up to 34.6300 Feeder Cattle Front Month down to 124.3252

Futures Technical Analysis – TD

Light Sweet Crude Oil Front Month up to 67.9800

March 9, 2021 11:17 am | By Autochartist

Rising Wedge identified at 09-Mar-2021 05:00 EST. This pattern is... Read more →

Feeder Cattle Front Month down to 137.2250

March 9, 2021 11:17 am | By Autochartist

Channel Down identified at 08-Mar-2021 14:00 EST. This pattern is... Read more →

Soybean Oil up to 53.2300

March 9, 2021 11:17 am | By Autochartist

Channel Up identified at 09-Mar-2021 04:30 EST. This pattern is... Read more →

Silver Front Month up to 26.5600

March 9, 2021 11:17 am | By Autochartist

Approaching Resistance level of 26.5600 identified at 09-Mar-2021 04:00 EST Read more →

10 year T-Note up to 133.1644

March 9, 2021 11:17 am | By Autochartist

Falling Wedge has broken through the resistance line at 09-Mar-2021... Read more →

  • About Us
  • Privacy Policy
  • Disclaimer
  • Terms and Conditions
  • Get started for FREE
  • Contact Us
Copyright © 2022 Autochartist.com. All rights reserved.
This site uses cookies: Find out more.