Help & Documentation
  • Home
  • Sign In
  • Contact Us
  • Home
  • Sign In
  • Contact Us

Jpmorgan Chase & Co. () up to 145.51

/US Stocks Technical Analysis - TD/Jpmorgan Chase & Co. () up to 145.51

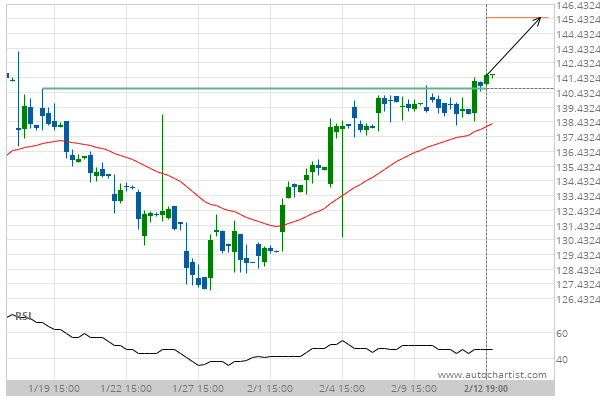
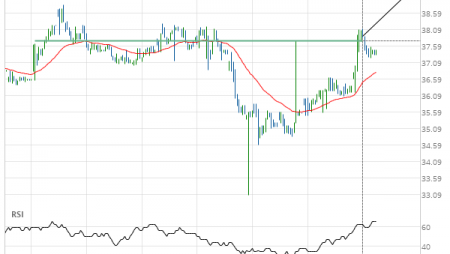
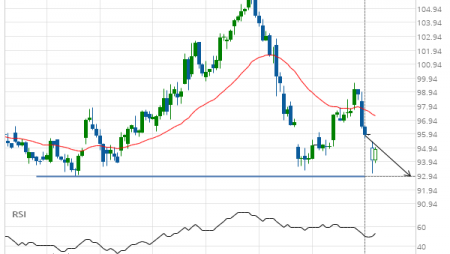
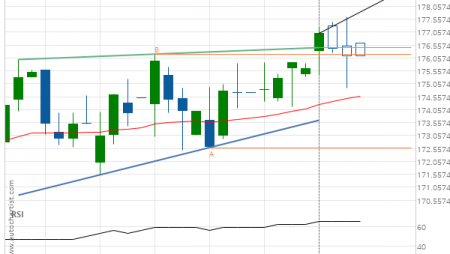
Jpmorgan Chase & Co. () up to 145.51

Posted on February 16, 2021 by Autochartist wrote in US Stocks Technical Analysis - TD.

Broke through Resistance level of 140.70 at 12-Feb-2021 19:00 EST

Tags: JPM, Jpmorgan Chase & Co.
0 Likes
427 Views

You may also like

Merck & Co. Inc. () up to 85.72
September 7, 2020
Exxon Mobil Corp. (XOM) down to 73.74
June 17, 2019
Merck & Co. Inc. (MRK) up to 76.47
January 9, 2019

Comments are closed.

Home Depot Inc. (HD) up to 279.76 Travelers Cos Inc. (TRV) up to 147.14

US Stocks Technical Analysis – TD

Merck & Co. Inc. (MRK) up to 75.56

March 9, 2021 11:13 am | By Autochartist

Rising Wedge identified at 08-Mar-2021 19:30 EST. This pattern is... Read more →

Jpmorgan Chase & Co. (JPM) down to 147.97

March 9, 2021 11:13 am | By Autochartist

Channel Up identified at 08-Mar-2021 19:00 EST. This pattern is... Read more →

Visa (V) down to 215.41

March 9, 2021 11:13 am | By Autochartist

Triangle identified at 08-Mar-2021 20:00 EST. This pattern is still... Read more →

Home Depot Inc. (HD) down to 247.10

March 9, 2021 11:13 am | By Autochartist

Channel Down identified at 08-Mar-2021 16:00 EST. This pattern is... Read more →

Intel Corporation () down to 58.10

March 9, 2021 11:13 am | By Autochartist

Approaching Support level of 58.10 identified at 08-Mar-2021 16:00 EST Read more →

  • About Us
  • Privacy Policy
  • Disclaimer
  • Terms and Conditions
  • Get started for FREE
  • Contact Us
Copyright © 2022 Autochartist.com. All rights reserved.
This site uses cookies: Find out more.