Help & Documentation
  • Home
  • Sign In
  • Contact Us
  • Home
  • Sign In
  • Contact Us

Jpmorgan Chase & Co. () up to 130.68

/US Stocks Technical Analysis - TD/Jpmorgan Chase & Co. () up to 130.68

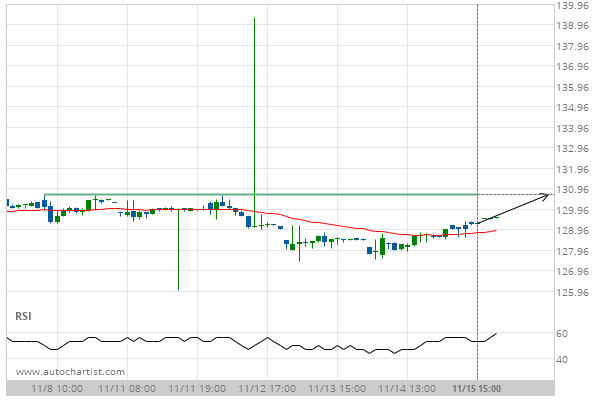
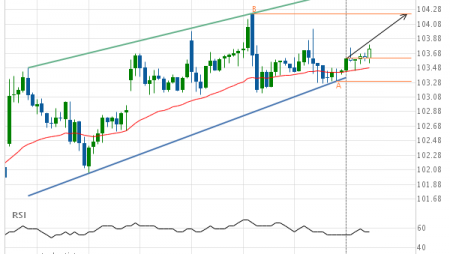
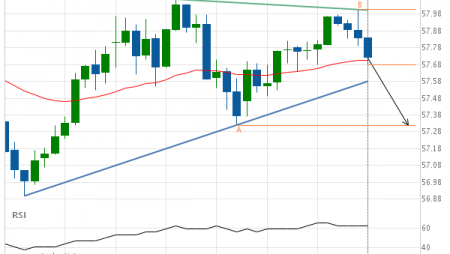
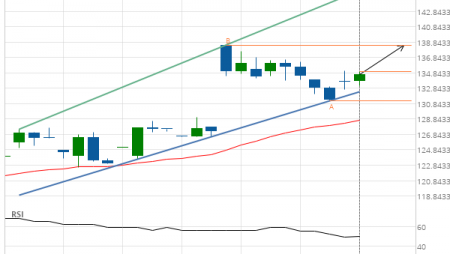
Jpmorgan Chase & Co. () up to 130.68

Posted on November 18, 2019 by Autochartist wrote in US Stocks Technical Analysis - TD.

Approaching Resistance level of 130.68 identified at 15-Nov-2019 15:00 EST

Tags: JPM, Jpmorgan Chase & Co.
0 Likes
504 Views

You may also like

Exxon Mobil Corp. (XOM) down to 36.34
April 10, 2020
Goldman Sachs Group Inc. () down to 174.84
February 11, 2019
Chevron () down to 85.37
December 15, 2020

Comments are closed.

Exxon Mobil Corp. (XOM) up to 69.30 Merck & Co. Inc. (MRK) up to 85.83

US Stocks Technical Analysis – TD

Merck & Co. Inc. (MRK) up to 75.56

March 9, 2021 11:13 am | By Autochartist

Rising Wedge identified at 08-Mar-2021 19:30 EST. This pattern is... Read more →

Jpmorgan Chase & Co. (JPM) down to 147.97

March 9, 2021 11:13 am | By Autochartist

Channel Up identified at 08-Mar-2021 19:00 EST. This pattern is... Read more →

Visa (V) down to 215.41

March 9, 2021 11:13 am | By Autochartist

Triangle identified at 08-Mar-2021 20:00 EST. This pattern is still... Read more →

Home Depot Inc. (HD) down to 247.10

March 9, 2021 11:13 am | By Autochartist

Channel Down identified at 08-Mar-2021 16:00 EST. This pattern is... Read more →

Intel Corporation () down to 58.10

March 9, 2021 11:13 am | By Autochartist

Approaching Support level of 58.10 identified at 08-Mar-2021 16:00 EST Read more →

  • About Us
  • Privacy Policy
  • Disclaimer
  • Terms and Conditions
  • Get started for FREE
  • Contact Us
Copyright © 2020 Autochartist.com. All rights reserved.
This site uses cookies: Find out more.