Help & Documentation
  • Home
  • Sign In
  • Contact Us
  • Home
  • Sign In
  • Contact Us

Intel Corporation () up to 61.00

/US Stocks Technical Analysis - TD/Intel Corporation () up to 61.00

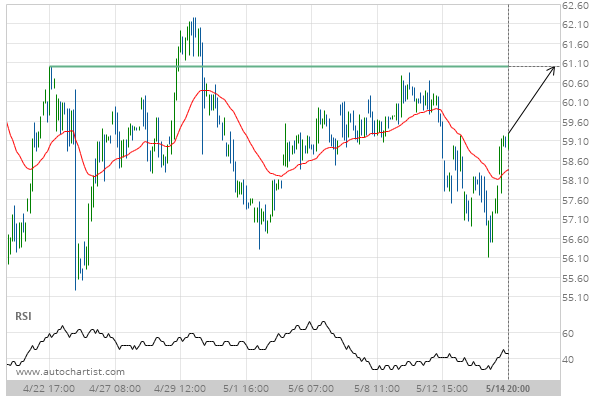
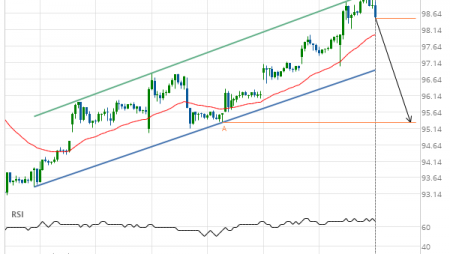
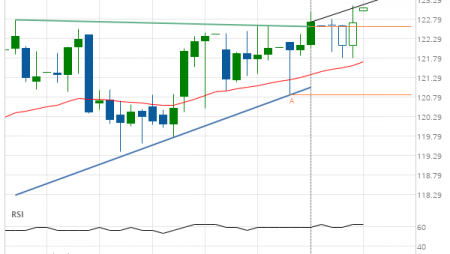
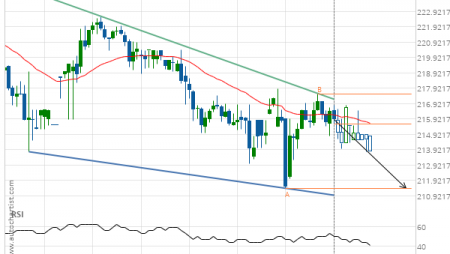
Intel Corporation () up to 61.00

Posted on May 15, 2020 by Autochartist wrote in US Stocks Technical Analysis - TD.

Approaching Resistance level of 61.00 identified at 14-May-2020 20:00 EDT

Tags: INTC, Intel Corporation
0 Likes
422 Views

You may also like

Intel Corporation () down to 46.60
November 21, 2018
Home Depot Inc. (HD) up to 202.87
April 12, 2019
Merck & Co. Inc. (MRK) down to 78.85
September 16, 2019

Comments are closed.

Exxon Mobil Corp. (XOM) up to 46.50 Home Depot Inc. (HD) up to 238.77

US Stocks Technical Analysis – TD

Merck & Co. Inc. (MRK) up to 75.56

March 9, 2021 11:13 am | By Autochartist

Rising Wedge identified at 08-Mar-2021 19:30 EST. This pattern is... Read more →

Jpmorgan Chase & Co. (JPM) down to 147.97

March 9, 2021 11:13 am | By Autochartist

Channel Up identified at 08-Mar-2021 19:00 EST. This pattern is... Read more →

Visa (V) down to 215.41

March 9, 2021 11:13 am | By Autochartist

Triangle identified at 08-Mar-2021 20:00 EST. This pattern is still... Read more →

Home Depot Inc. (HD) down to 247.10

March 9, 2021 11:13 am | By Autochartist

Channel Down identified at 08-Mar-2021 16:00 EST. This pattern is... Read more →

Intel Corporation () down to 58.10

March 9, 2021 11:13 am | By Autochartist

Approaching Support level of 58.10 identified at 08-Mar-2021 16:00 EST Read more →

  • About Us
  • Privacy Policy
  • Disclaimer
  • Terms and Conditions
  • Get started for FREE
  • Contact Us
Copyright © 2020 Autochartist.com. All rights reserved.
This site uses cookies: Find out more.