Help & Documentation
  • Home
  • Sign In
  • Contact Us
  • Home
  • Sign In
  • Contact Us

Home Depot Inc. () up to 290.99

/US Stocks Technical Analysis - TD/Home Depot Inc. () up to 290.99

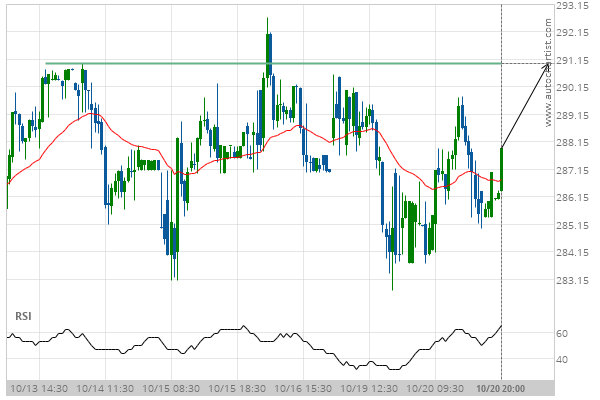
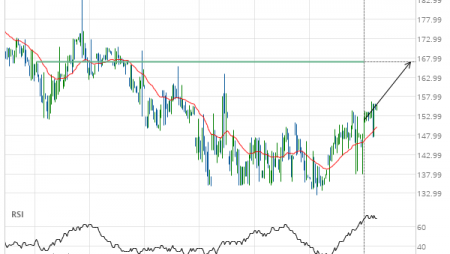
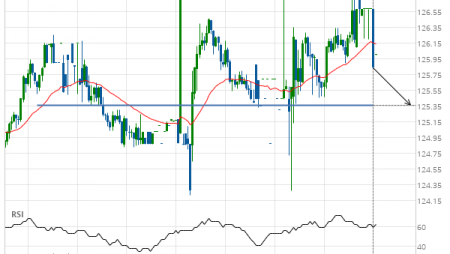
Home Depot Inc. () up to 290.99

Posted on October 21, 2020 by Autochartist wrote in US Stocks Technical Analysis - TD.

Approaching Resistance level of 290.99 identified at 20-Oct-2020 20:00 EDT

Tags: HD, Home Depot Inc.
0 Likes
391 Views

You may also like

Merck & Co. Inc. (MRK) down to 77.85
July 22, 2020
Jpmorgan Chase & Co. (JPM) down to 98.02
October 12, 2020
Caterpillar Inc. () up to 139.69
March 5, 2019

Comments are closed.

Intel Corporation (INTC) down to 52.80 Exxon Mobil Corp. (XOM) down to 32.94

US Stocks Technical Analysis – TD

Merck & Co. Inc. (MRK) up to 75.56

March 9, 2021 11:13 am | By Autochartist

Rising Wedge identified at 08-Mar-2021 19:30 EST. This pattern is... Read more →

Jpmorgan Chase & Co. (JPM) down to 147.97

March 9, 2021 11:13 am | By Autochartist

Channel Up identified at 08-Mar-2021 19:00 EST. This pattern is... Read more →

Visa (V) down to 215.41

March 9, 2021 11:13 am | By Autochartist

Triangle identified at 08-Mar-2021 20:00 EST. This pattern is still... Read more →

Home Depot Inc. (HD) down to 247.10

March 9, 2021 11:13 am | By Autochartist

Channel Down identified at 08-Mar-2021 16:00 EST. This pattern is... Read more →

Intel Corporation () down to 58.10

March 9, 2021 11:13 am | By Autochartist

Approaching Support level of 58.10 identified at 08-Mar-2021 16:00 EST Read more →

  • About Us
  • Privacy Policy
  • Disclaimer
  • Terms and Conditions
  • Get started for FREE
  • Contact Us
Copyright © 2022 Autochartist.com. All rights reserved.
This site uses cookies: Find out more.