Help & Documentation
  • Home
  • Sign In
  • Contact Us
  • Home
  • Sign In
  • Contact Us

Home Depot Inc. () up to 244.44

/US Stocks Technical Analysis - TD/Home Depot Inc. () up to 244.44

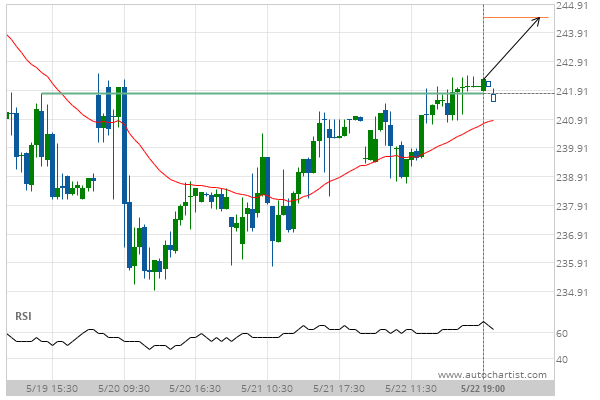
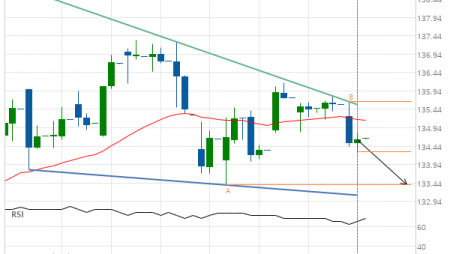
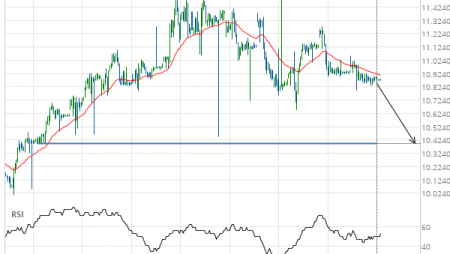
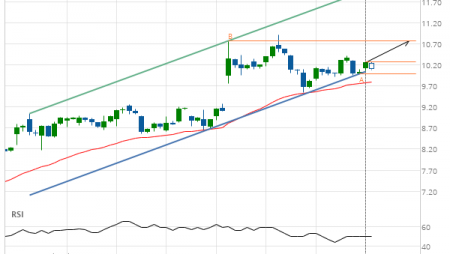
Home Depot Inc. () up to 244.44

Posted on May 26, 2020 by admin wrote in US Stocks Technical Analysis - TD.

Broke through Resistance level of 241.80 at 22-May-2020 19:00 EDT

Tags: HD, Home Depot Inc.
0 Likes
121 Views

You may also like

United Technologies Corp. (UTX) down to 118.46
February 8, 2019
Travelers Cos Inc. (TRV) up to 148.65
September 30, 2019
Intel Corporation (INTC) down to 56.76
July 9, 2020

Comments are closed.

EUR/CHF up to 1.0628 Nike Inc. Cl B (NKE) up to 94.98

US Stocks Technical Analysis – TD

Goldman Sachs Group Inc. (GS) down to 291.97

January 20, 2021 11:15 am | By admin

Rising Wedge has broken through the support line at 19-Jan-2021... Read more →

Exxon Mobil Corp. (XOM) up to 51.08

January 20, 2021 11:15 am | By admin

Channel Up identified at 19-Jan-2021 13:00 EST. This pattern is... Read more →

Jpmorgan Chase & Co. (JPM) down to 136.77

January 20, 2021 11:15 am | By admin

Falling Wedge identified at 19-Jan-2021 18:00 EST. This pattern is... Read more →

Nike Inc. Cl B () down to 135.96

January 20, 2021 11:15 am | By admin

Broke through Support level of 139.81 at 19-Jan-2021 12:00 EST Read more →

Caterpillar Inc. (CAT) down to 190.88

January 20, 2021 11:15 am | By admin

Descending Triangle identified at 19-Jan-2021 15:00 EST. This pattern is... Read more →

  • About Us
  • Privacy Policy
  • Disclaimer
  • Terms and Conditions
  • Get started for FREE
  • Contact Us
Copyright © 2020 Autochartist.com. All rights reserved.
This site uses cookies: Find out more.