Help & Documentation
  • Home
  • Sign In
  • Contact Us
  • Home
  • Sign In
  • Contact Us

Home Depot Inc. () up to 225.90

/US Stocks Technical Analysis - TD/Home Depot Inc. () up to 225.90

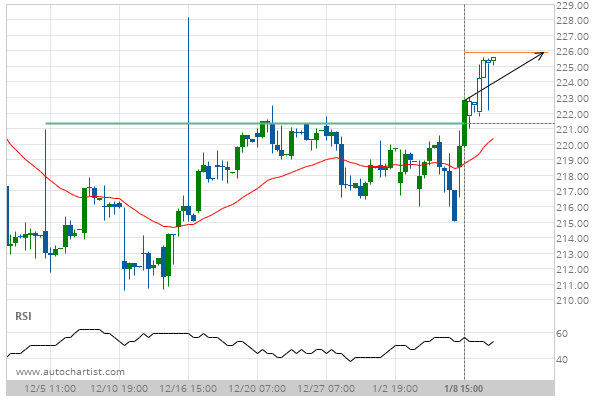
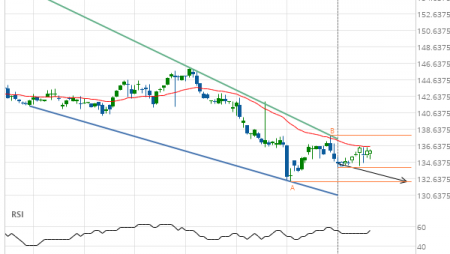
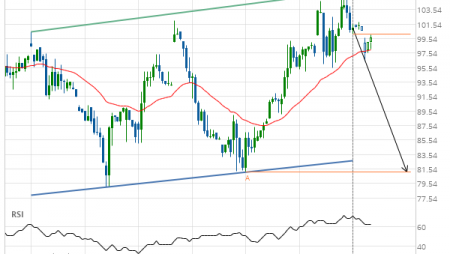
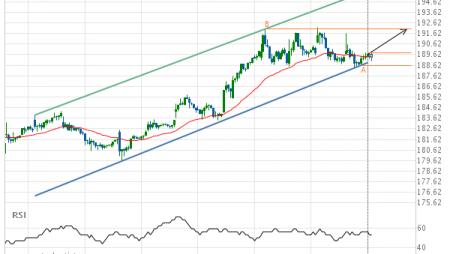
Home Depot Inc. () up to 225.90

Posted on January 10, 2020 by Autochartist wrote in US Stocks Technical Analysis - TD.

Broke through Resistance level of 221.34 at 08-Jan-2020 15:00 EST

Tags: HD, Home Depot Inc.
0 Likes
546 Views

You may also like

Boeing Co. (BA) up to 383.29
September 25, 2019
Pfizer Inc. () down to 38.29
January 10, 2020
Home Depot Inc. (HD) down to 241.88
February 24, 2020

Comments are closed.

Soybean Oil up to 35.1800 Exxon Mobil Corp. (XOM) up to 70.91

US Stocks Technical Analysis – TD

Merck & Co. Inc. (MRK) up to 75.56

March 9, 2021 11:13 am | By Autochartist

Rising Wedge identified at 08-Mar-2021 19:30 EST. This pattern is... Read more →

Jpmorgan Chase & Co. (JPM) down to 147.97

March 9, 2021 11:13 am | By Autochartist

Channel Up identified at 08-Mar-2021 19:00 EST. This pattern is... Read more →

Visa (V) down to 215.41

March 9, 2021 11:13 am | By Autochartist

Triangle identified at 08-Mar-2021 20:00 EST. This pattern is still... Read more →

Home Depot Inc. (HD) down to 247.10

March 9, 2021 11:13 am | By Autochartist

Channel Down identified at 08-Mar-2021 16:00 EST. This pattern is... Read more →

Intel Corporation () down to 58.10

March 9, 2021 11:13 am | By Autochartist

Approaching Support level of 58.10 identified at 08-Mar-2021 16:00 EST Read more →

  • About Us
  • Privacy Policy
  • Disclaimer
  • Terms and Conditions
  • Get started for FREE
  • Contact Us
Copyright © 2020 Autochartist.com. All rights reserved.
This site uses cookies: Find out more.