Help & Documentation
  • Home
  • Sign In
  • Contact Us
  • Home
  • Sign In
  • Contact Us

Home Depot Inc. () up to 221.72

/US Stocks Technical Analysis - TD/Home Depot Inc. () up to 221.72

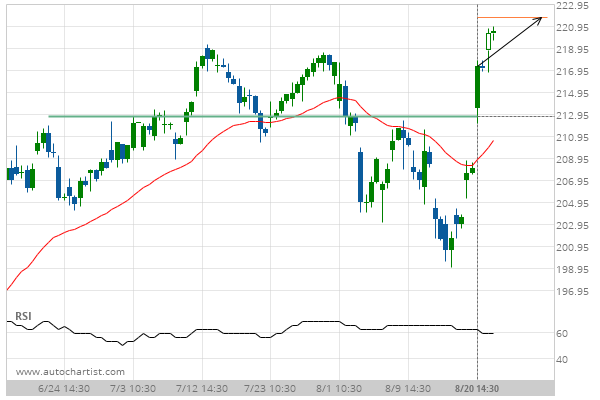
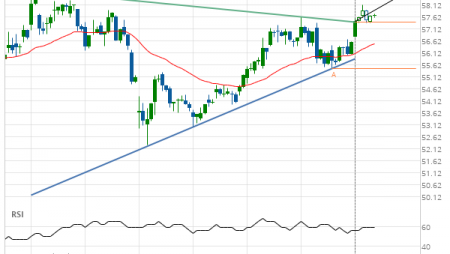
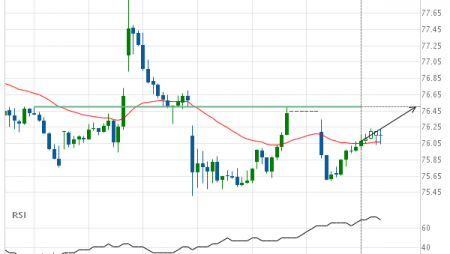
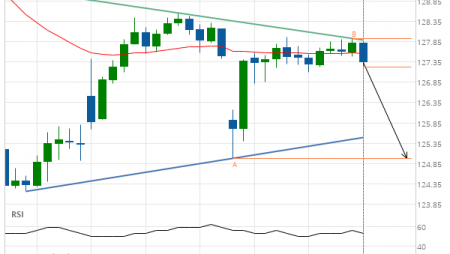
Home Depot Inc. () up to 221.72

Posted on August 22, 2019 by Autochartist wrote in US Stocks Technical Analysis - TD.

Broke through Resistance level of 212.75 at 20-Aug-2019 14:30 EDT

Tags: HD, Home Depot Inc.
0 Likes
656 Views

You may also like

General Electric Co. (GE) down to 6.85
June 18, 2020
Jpmorgan Chase & Co. (JPM) up to 115.57
July 17, 2019
Jpmorgan Chase & Co. (JPM) down to 98.02
October 12, 2020

Comments are closed.

International Business Machines Corp. (IBM) up to 135.94 Why is it worth watching the Gold Silver ratio?

US Stocks Technical Analysis – TD

Merck & Co. Inc. (MRK) up to 75.56

March 9, 2021 11:13 am | By Autochartist

Rising Wedge identified at 08-Mar-2021 19:30 EST. This pattern is... Read more →

Visa (V) down to 215.41

March 9, 2021 11:13 am | By Autochartist

Triangle identified at 08-Mar-2021 20:00 EST. This pattern is still... Read more →

Jpmorgan Chase & Co. (JPM) down to 147.97

March 9, 2021 11:13 am | By Autochartist

Channel Up identified at 08-Mar-2021 19:00 EST. This pattern is... Read more →

Home Depot Inc. (HD) down to 247.10

March 9, 2021 11:13 am | By Autochartist

Channel Down identified at 08-Mar-2021 16:00 EST. This pattern is... Read more →

Intel Corporation () down to 58.10

March 9, 2021 11:13 am | By Autochartist

Approaching Support level of 58.10 identified at 08-Mar-2021 16:00 EST Read more →

  • About Us
  • Privacy Policy
  • Disclaimer
  • Terms and Conditions
  • Get started for FREE
  • Contact Us
Copyright © 2020 Autochartist.com. All rights reserved.
This site uses cookies: Find out more.