Help & Documentation
  • Home
  • Sign In
  • Contact Us
  • Home
  • Sign In
  • Contact Us

Home Depot Inc. () up to 182.66

/US Stocks Technical Analysis - TD/Home Depot Inc. () up to 182.66

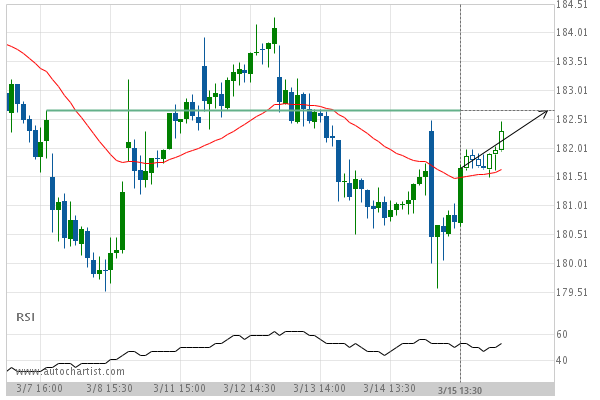
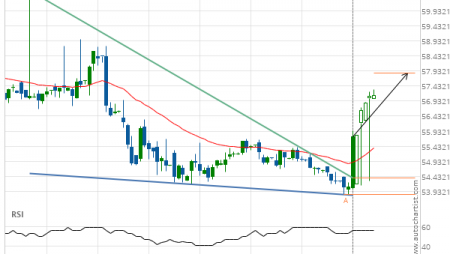
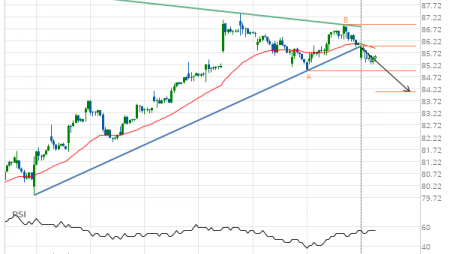
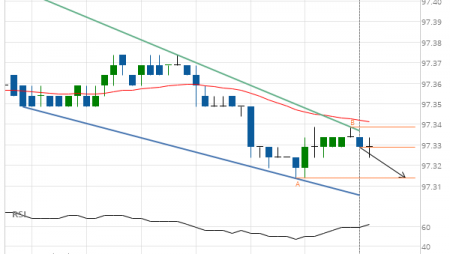
Home Depot Inc. () up to 182.66

Posted on March 18, 2019 by Autochartist wrote in US Stocks Technical Analysis - TD.

Approaching Resistance level of 182.66 identified at 15-Mar-2019 13:30 EDT

Tags: HD, Home Depot Inc.
0 Likes
683 Views

You may also like

Travelers Cos Inc. (TRV) down to 113.58
September 7, 2020
Jpmorgan Chase & Co. () up to 127.13
December 21, 2020
Verizon Communications Inc. (VZ) down to 56.10
January 8, 2019

Comments are closed.

3m Co. Target Level: 208.66 Boeing Co. (BA) excessive bearish movement

US Stocks Technical Analysis – TD

Merck & Co. Inc. (MRK) up to 75.56

March 9, 2021 11:13 am | By Autochartist

Rising Wedge identified at 08-Mar-2021 19:30 EST. This pattern is... Read more →

Jpmorgan Chase & Co. (JPM) down to 147.97

March 9, 2021 11:13 am | By Autochartist

Channel Up identified at 08-Mar-2021 19:00 EST. This pattern is... Read more →

Visa (V) down to 215.41

March 9, 2021 11:13 am | By Autochartist

Triangle identified at 08-Mar-2021 20:00 EST. This pattern is still... Read more →

Home Depot Inc. (HD) down to 247.10

March 9, 2021 11:13 am | By Autochartist

Channel Down identified at 08-Mar-2021 16:00 EST. This pattern is... Read more →

Intel Corporation () down to 58.10

March 9, 2021 11:13 am | By Autochartist

Approaching Support level of 58.10 identified at 08-Mar-2021 16:00 EST Read more →

  • About Us
  • Privacy Policy
  • Disclaimer
  • Terms and Conditions
  • Get started for FREE
  • Contact Us
Copyright © 2020 Autochartist.com. All rights reserved.
This site uses cookies: Find out more.