Help & Documentation
  • Home
  • Sign In
  • Contact Us
  • Home
  • Sign In
  • Contact Us

Home Depot Inc. (HD) down to 213.01

/US Stocks Technical Analysis - TD/Home Depot Inc. (HD) down to 213.01

Home Depot Inc. (HD) down to 213.01

Posted on August 28, 2019 by Autochartist wrote in US Stocks Technical Analysis - TD.

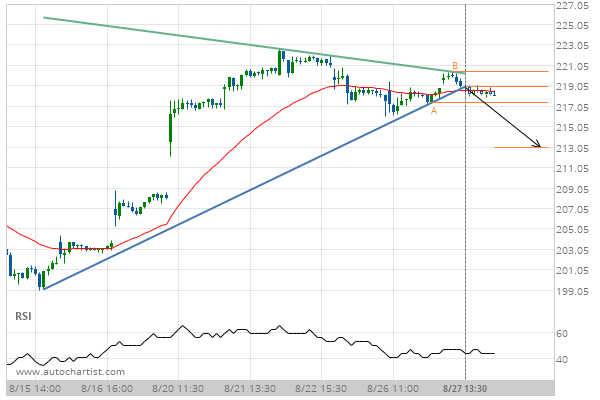
Triangle has broken through the support line at 27-Aug-2019 13:30 EDT. Possible bearish price movement forecast for the next 13 hours towards 213.01.

Tags: HD, Home Depot Inc., NYSE
0 Likes
595 Views

You may also like

WALT DISNEY (DIS) down to 108.80
May 18, 2020
Coca-Cola Co. (KO) up to 52.19
June 21, 2019
Chevron (CVX) up to 121.32
September 21, 2018

Comments are closed.

International Business Machines Corp. (IBM) up to 135.68 American Express Co. is on its way down

US Stocks Technical Analysis – TD

Merck & Co. Inc. (MRK) up to 75.56

March 9, 2021 11:13 am | By Autochartist

Rising Wedge identified at 08-Mar-2021 19:30 EST. This pattern is... Read more →

Jpmorgan Chase & Co. (JPM) down to 147.97

March 9, 2021 11:13 am | By Autochartist

Channel Up identified at 08-Mar-2021 19:00 EST. This pattern is... Read more →

Visa (V) down to 215.41

March 9, 2021 11:13 am | By Autochartist

Triangle identified at 08-Mar-2021 20:00 EST. This pattern is still... Read more →

Home Depot Inc. (HD) down to 247.10

March 9, 2021 11:13 am | By Autochartist

Channel Down identified at 08-Mar-2021 16:00 EST. This pattern is... Read more →

Intel Corporation () down to 58.10

March 9, 2021 11:13 am | By Autochartist

Approaching Support level of 58.10 identified at 08-Mar-2021 16:00 EST Read more →

  • About Us
  • Privacy Policy
  • Disclaimer
  • Terms and Conditions
  • Get started for FREE
  • Contact Us
Copyright © 2020 Autochartist.com. All rights reserved.
This site uses cookies: Find out more.