Help & Documentation
  • Home
  • Sign In
  • Contact Us
  • Home
  • Sign In
  • Contact Us

Home Depot Inc. (HD) down to 174.22

/US Stocks Technical Analysis - TD/Home Depot Inc. (HD) down to 174.22

Home Depot Inc. (HD) down to 174.22

Posted on February 8, 2019 by Autochartist wrote in US Stocks Technical Analysis - TD.

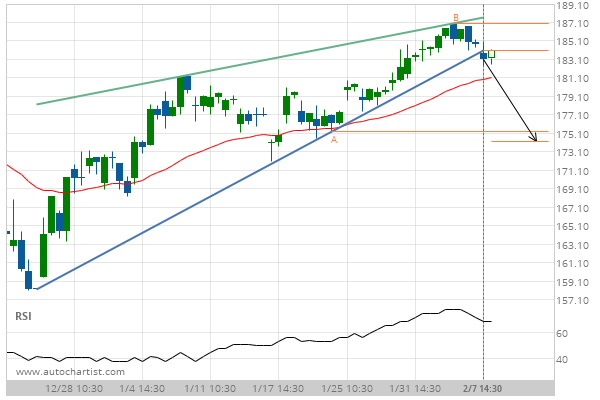
Rising Wedge has broken through the support line at 07-Feb-2019 14:30 EST. Possible bearish price movement forecast for the next 4 days towards 174.22.

Tags: HD, Home Depot Inc., NYSE
1 Likes
865 Views

You may also like

Nike Inc. Cl B (NKE) down to 80.89
April 3, 2019
3m Co. () down to 171.89
July 22, 2019
3m Co. (MMM) down to 159.19
June 9, 2020

Comments are closed.

United Technologies Corp. (UTX) down to 118.46 Nike Inc. Cl B (NKE) down to 80.83

US Stocks Technical Analysis – TD

Merck & Co. Inc. (MRK) up to 75.56

March 9, 2021 11:13 am | By Autochartist

Rising Wedge identified at 08-Mar-2021 19:30 EST. This pattern is... Read more →

Jpmorgan Chase & Co. (JPM) down to 147.97

March 9, 2021 11:13 am | By Autochartist

Channel Up identified at 08-Mar-2021 19:00 EST. This pattern is... Read more →

Visa (V) down to 215.41

March 9, 2021 11:13 am | By Autochartist

Triangle identified at 08-Mar-2021 20:00 EST. This pattern is still... Read more →

Home Depot Inc. (HD) down to 247.10

March 9, 2021 11:13 am | By Autochartist

Channel Down identified at 08-Mar-2021 16:00 EST. This pattern is... Read more →

Intel Corporation () down to 58.10

March 9, 2021 11:13 am | By Autochartist

Approaching Support level of 58.10 identified at 08-Mar-2021 16:00 EST Read more →

  • About Us
  • Privacy Policy
  • Disclaimer
  • Terms and Conditions
  • Get started for FREE
  • Contact Us
Copyright © 2022 Autochartist.com. All rights reserved.
This site uses cookies: Find out more.