Help & Documentation
  • Home
  • Sign In
  • Contact Us
  • Home
  • Sign In
  • Contact Us

Home Depot Inc. () down to 228.28

/US Stocks Technical Analysis - TD/Home Depot Inc. () down to 228.28

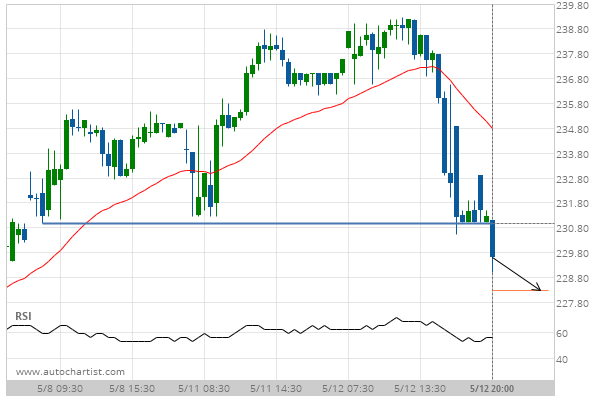
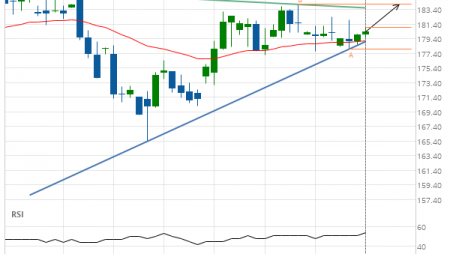
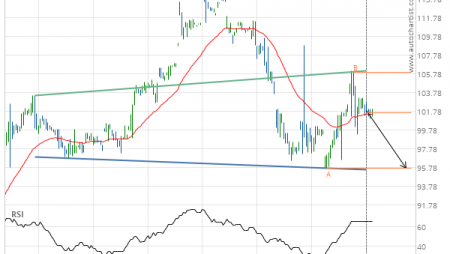
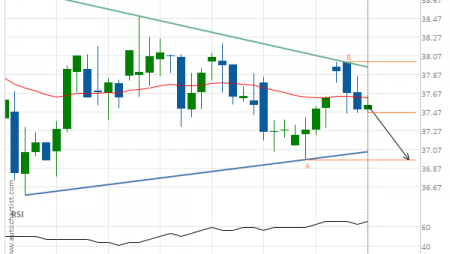
Home Depot Inc. () down to 228.28

Posted on May 13, 2020 by Autochartist wrote in US Stocks Technical Analysis - TD.

Broke through Support level of 230.97 at 12-May-2020 20:00 EDT

Tags: HD, Home Depot Inc.
0 Likes
395 Views

You may also like

Travelers Cos Inc. (TRV) down to 110.55
July 2, 2020
Microsoft Corporation (MSFT) down to 101.59
October 29, 2018
Chevron () down to 88.65
May 25, 2020

Comments are closed.

Intel Corporation (INTC) down to 56.31 GBP/NZD up to 2.0557

US Stocks Technical Analysis – TD

Merck & Co. Inc. (MRK) up to 75.56

March 9, 2021 11:13 am | By Autochartist

Rising Wedge identified at 08-Mar-2021 19:30 EST. This pattern is... Read more →

Jpmorgan Chase & Co. (JPM) down to 147.97

March 9, 2021 11:13 am | By Autochartist

Channel Up identified at 08-Mar-2021 19:00 EST. This pattern is... Read more →

Visa (V) down to 215.41

March 9, 2021 11:13 am | By Autochartist

Triangle identified at 08-Mar-2021 20:00 EST. This pattern is still... Read more →

Home Depot Inc. (HD) down to 247.10

March 9, 2021 11:13 am | By Autochartist

Channel Down identified at 08-Mar-2021 16:00 EST. This pattern is... Read more →

Intel Corporation () down to 58.10

March 9, 2021 11:13 am | By Autochartist

Approaching Support level of 58.10 identified at 08-Mar-2021 16:00 EST Read more →

  • About Us
  • Privacy Policy
  • Disclaimer
  • Terms and Conditions
  • Get started for FREE
  • Contact Us
Copyright © 2020 Autochartist.com. All rights reserved.
This site uses cookies: Find out more.