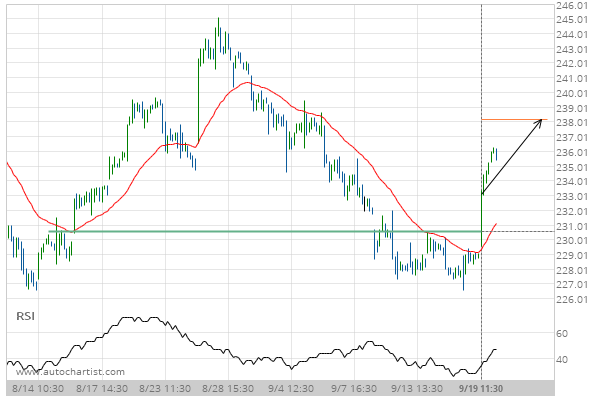
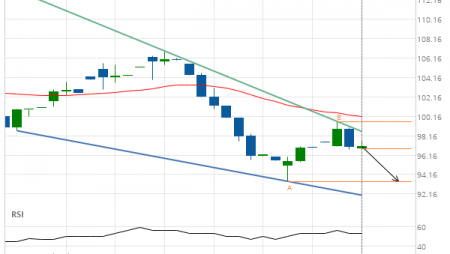
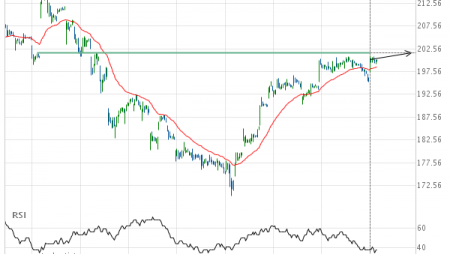
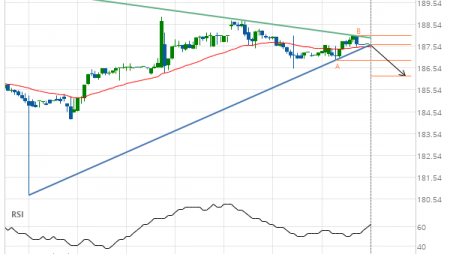
Goldman Sachs Group Inc. () up to 238.16 Posted on September 20, 2018 by Autochartist wrote in US Stocks Technical Analysis - TD. Broke through Resistance level of 230.55 at 19-Sep-2018 11:30 EDT Tags: Goldman Sachs Group Inc., GS 0 Likes 1273 Views You may also like Travelers Cos Inc. (TRV) down to 93.45 May 6, 2020 Apple Inc. () up to 201.68 June 27, 2019 Visa (V) down to 186.16 December 25, 2019 Comments are closed.