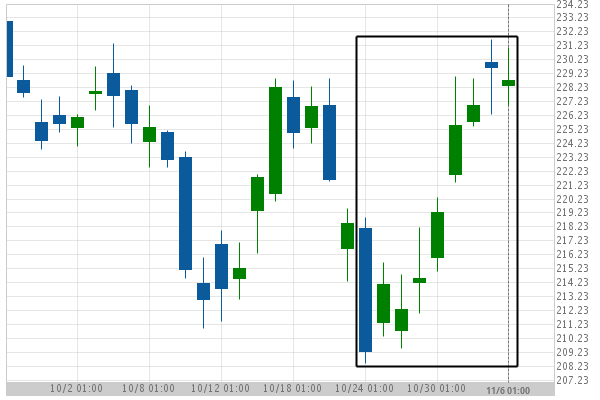
Goldman Sachs Group Inc. (GS) excessive bearish movement Posted on November 6, 2018 by Autochartist wrote in US Stocks Statistical Analysis - TD. Goldman Sachs Group Inc. experienced a 4.85% bullish movement in the last 12 days. Tags: Goldman Sachs Group Inc., GS 0 Likes 1089 Views You may also like Nike Inc. Cl B (NKE) excessive bearish movement October 6, 2020 Microsoft Corporation (MSFT) excessive bearish movement October 30, 2018 Jpmorgan Chase & Co. (JPM) excessive bullish movement October 5, 2018 Comments are closed.