Goldman Sachs Group Inc. (GS) excessive bearish movement Posted on June 5, 2020 by Autochartist wrote in US Stocks Statistical Analysis - TD. 
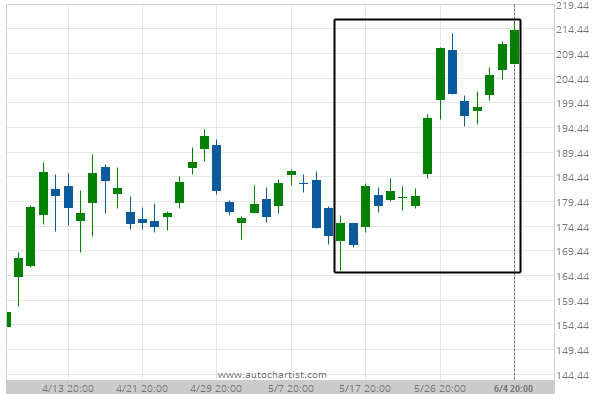
Goldman Sachs Group Inc. experienced a 22.34% bullish movement in the last 22 days. Tags: Goldman Sachs Group Inc., GS 0 Likes 527 Views You may also like Caterpillar Inc. (CAT) excessive bearish movement October 22, 2018 Coca-Cola Co. (KO) excessive bullish movement December 31, 2020 Microsoft Corporation (MSFT) excessive bearish movement November 9, 2018 Comments are closed.