Help & Documentation
  • Home
  • Sign In
  • Contact Us
  • Home
  • Sign In
  • Contact Us

Goldman Sachs Group Inc. () down to 244.60

/US Stocks Technical Analysis - TD/Goldman Sachs Group Inc. () down to 244.60

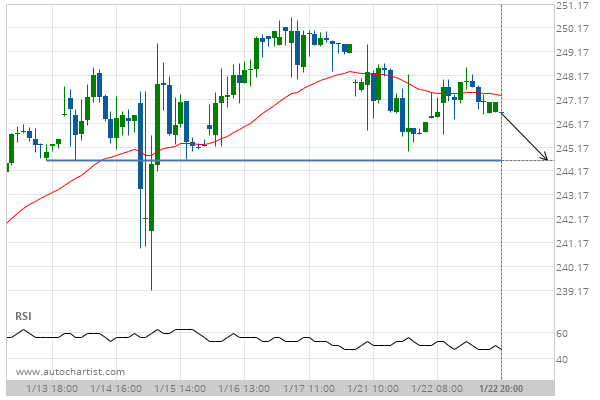
Goldman Sachs Group Inc. () down to 244.60

Posted on January 23, 2020 by Autochartist wrote in US Stocks Technical Analysis - TD.

Approaching Support level of 244.60 identified at 22-Jan-2020 20:00 EST

Tags: Goldman Sachs Group Inc., GS
0 Likes
492 Views

You may also like

Wal-Mart Stores (WMT) down to 129.61
March 2, 2021
Intel Corporation (INTC) down to 46.18
November 22, 2018
Merck & Co. Inc. (MRK) down to 67.82
October 16, 2018

Comments are closed.

Home Depot Inc. (HD) down to 222.02 Travelers Cos Inc. (TRV) excessive bullish movement

US Stocks Technical Analysis – TD

Merck & Co. Inc. (MRK) up to 75.56

March 9, 2021 11:13 am | By Autochartist

Rising Wedge identified at 08-Mar-2021 19:30 EST. This pattern is... Read more →

Jpmorgan Chase & Co. (JPM) down to 147.97

March 9, 2021 11:13 am | By Autochartist

Channel Up identified at 08-Mar-2021 19:00 EST. This pattern is... Read more →

Visa (V) down to 215.41

March 9, 2021 11:13 am | By Autochartist

Triangle identified at 08-Mar-2021 20:00 EST. This pattern is still... Read more →

Home Depot Inc. (HD) down to 247.10

March 9, 2021 11:13 am | By Autochartist

Channel Down identified at 08-Mar-2021 16:00 EST. This pattern is... Read more →

Intel Corporation () down to 58.10

March 9, 2021 11:13 am | By Autochartist

Approaching Support level of 58.10 identified at 08-Mar-2021 16:00 EST Read more →

  • About Us
  • Privacy Policy
  • Disclaimer
  • Terms and Conditions
  • Get started for FREE
  • Contact Us
Copyright © 2020 Autochartist.com. All rights reserved.
This site uses cookies: Find out more.