Help & Documentation
  • Home
  • Sign In
  • Contact Us
  • Home
  • Sign In
  • Contact Us

Goldman Sachs Group Inc. () down to 193.53

/US Stocks Technical Analysis - TD/Goldman Sachs Group Inc. () down to 193.53

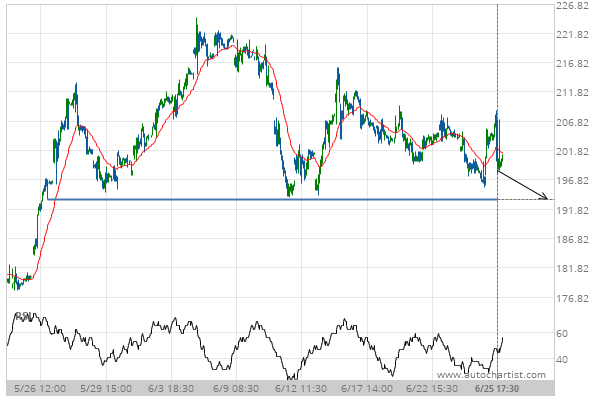
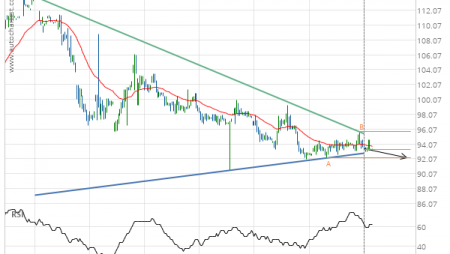
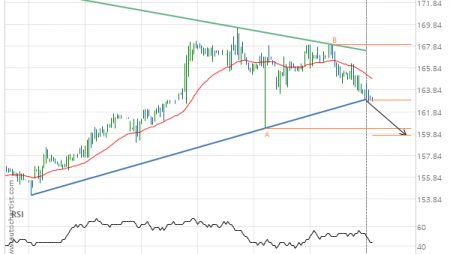
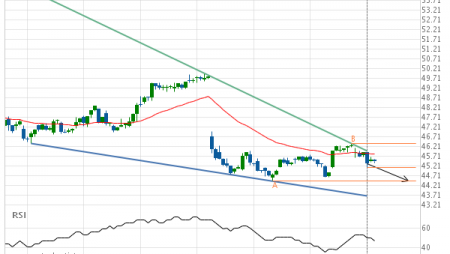
Goldman Sachs Group Inc. () down to 193.53

Posted on June 26, 2020 by Autochartist wrote in US Stocks Technical Analysis - TD.

Approaching Support level of 193.53 identified at 25-Jun-2020 17:30 EDT

Tags: Goldman Sachs Group Inc., GS
0 Likes
591 Views

You may also like

Home Depot Inc. (HD) down to 198.66
May 6, 2019
Home Depot Inc. (HD) up to 231.50
May 8, 2020
Goldman Sachs Group Inc. () up to 205.84
August 30, 2019

Comments are closed.

Verizon Communications Inc. () down to 52.48 Gold Front Month down to 1706.2000

US Stocks Technical Analysis – TD

Merck & Co. Inc. (MRK) up to 75.56

March 9, 2021 11:13 am | By Autochartist

Rising Wedge identified at 08-Mar-2021 19:30 EST. This pattern is... Read more →

Jpmorgan Chase & Co. (JPM) down to 147.97

March 9, 2021 11:13 am | By Autochartist

Channel Up identified at 08-Mar-2021 19:00 EST. This pattern is... Read more →

Visa (V) down to 215.41

March 9, 2021 11:13 am | By Autochartist

Triangle identified at 08-Mar-2021 20:00 EST. This pattern is still... Read more →

Home Depot Inc. (HD) down to 247.10

March 9, 2021 11:13 am | By Autochartist

Channel Down identified at 08-Mar-2021 16:00 EST. This pattern is... Read more →

Intel Corporation () down to 58.10

March 9, 2021 11:13 am | By Autochartist

Approaching Support level of 58.10 identified at 08-Mar-2021 16:00 EST Read more →

  • About Us
  • Privacy Policy
  • Disclaimer
  • Terms and Conditions
  • Get started for FREE
  • Contact Us
Copyright © 2022 Autochartist.com. All rights reserved.
This site uses cookies: Find out more.