Help & Documentation
  • Home
  • Sign In
  • Contact Us
  • Home
  • Sign In
  • Contact Us

Gold Front Month up to 1946.6400

/Futures Technical Analysis - TD/Gold Front Month up to 1946.6400

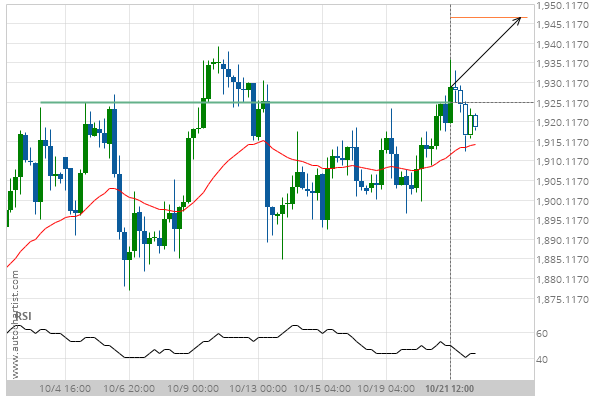
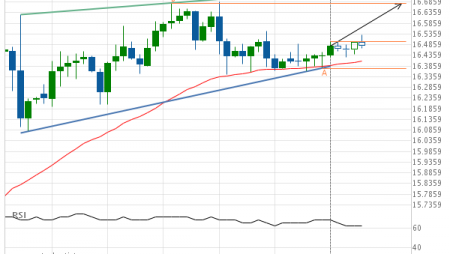
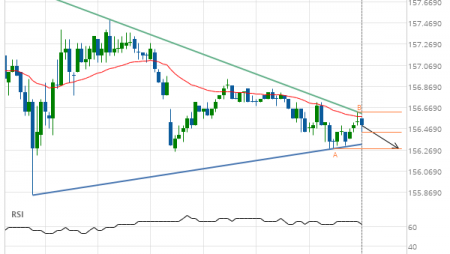
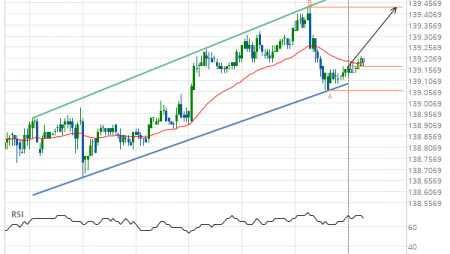
Gold Front Month up to 1946.6400

Posted on October 22, 2020 by Autochartist wrote in Futures Technical Analysis - TD.

Broke through Resistance level of 1924.9000 at 21-Oct-2020 12:00 EDT

Tags: GC
0 Likes
364 Views

You may also like

Soybean Oil down to 30.4022
October 29, 2019
Soybeans up to 849.5000
May 26, 2020
KC HRW Wheat up to 456.0000
August 25, 2020

Comments are closed.

Soybeans down to 1047.7500 Soybean Oil up to 33.8300

Futures Technical Analysis – TD

Light Sweet Crude Oil Front Month up to 67.9800

March 9, 2021 11:17 am | By Autochartist

Rising Wedge identified at 09-Mar-2021 05:00 EST. This pattern is... Read more →

Feeder Cattle Front Month down to 137.2250

March 9, 2021 11:17 am | By Autochartist

Channel Down identified at 08-Mar-2021 14:00 EST. This pattern is... Read more →

Soybean Oil up to 53.2300

March 9, 2021 11:17 am | By Autochartist

Channel Up identified at 09-Mar-2021 04:30 EST. This pattern is... Read more →

Silver Front Month up to 26.5600

March 9, 2021 11:17 am | By Autochartist

Approaching Resistance level of 26.5600 identified at 09-Mar-2021 04:00 EST Read more →

10 year T-Note up to 133.1644

March 9, 2021 11:17 am | By Autochartist

Falling Wedge has broken through the resistance line at 09-Mar-2021... Read more →

  • About Us
  • Privacy Policy
  • Disclaimer
  • Terms and Conditions
  • Get started for FREE
  • Contact Us
Copyright © 2022 Autochartist.com. All rights reserved.
This site uses cookies: Find out more.