Help & Documentation
  • Home
  • Sign In
  • Contact Us
  • Home
  • Sign In
  • Contact Us

Gold Front Month up to 1918.7000

/Futures Technical Analysis - TD/Gold Front Month up to 1918.7000

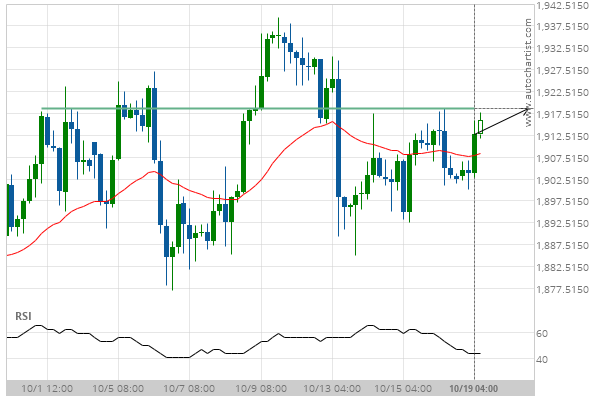
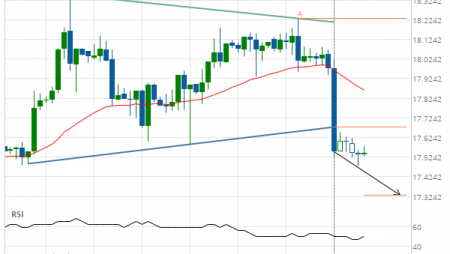
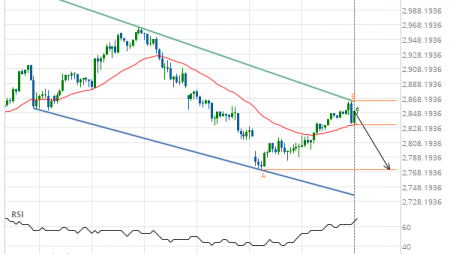
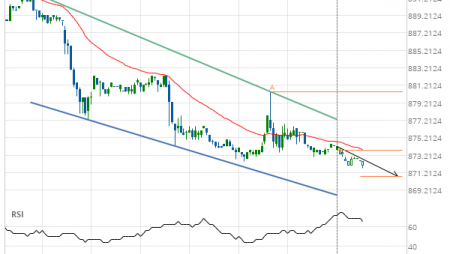
Gold Front Month up to 1918.7000

Posted on October 19, 2020 by Autochartist wrote in Futures Technical Analysis - TD.

Approaching Resistance level of 1918.7000 identified at 19-Oct-2020 04:00 EDT

Tags: GC
0 Likes
406 Views

You may also like

Gold Front Month up to 1588.4000
January 30, 2020
Light Sweet Crude Oil Front Month down to 56.0900
July 4, 2019
Soybean Oil down to 28.4470
March 6, 2020

Comments are closed.

KC HRW Wheat excessive bearish movement Silver Front Month up to 25.6730

Futures Technical Analysis – TD

Light Sweet Crude Oil Front Month up to 67.9800

March 9, 2021 11:17 am | By Autochartist

Rising Wedge identified at 09-Mar-2021 05:00 EST. This pattern is... Read more →

Feeder Cattle Front Month down to 137.2250

March 9, 2021 11:17 am | By Autochartist

Channel Down identified at 08-Mar-2021 14:00 EST. This pattern is... Read more →

Soybean Oil up to 53.2300

March 9, 2021 11:17 am | By Autochartist

Channel Up identified at 09-Mar-2021 04:30 EST. This pattern is... Read more →

Silver Front Month up to 26.5600

March 9, 2021 11:17 am | By Autochartist

Approaching Resistance level of 26.5600 identified at 09-Mar-2021 04:00 EST Read more →

10 year T-Note up to 133.1644

March 9, 2021 11:17 am | By Autochartist

Falling Wedge has broken through the resistance line at 09-Mar-2021... Read more →

  • About Us
  • Privacy Policy
  • Disclaimer
  • Terms and Conditions
  • Get started for FREE
  • Contact Us
Copyright © 2022 Autochartist.com. All rights reserved.
This site uses cookies: Find out more.