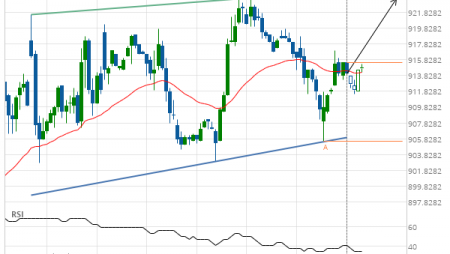
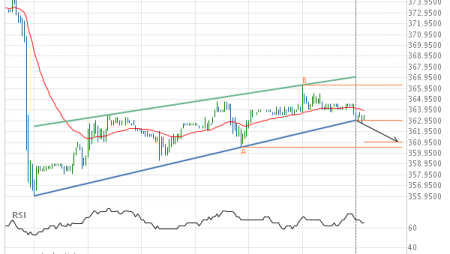
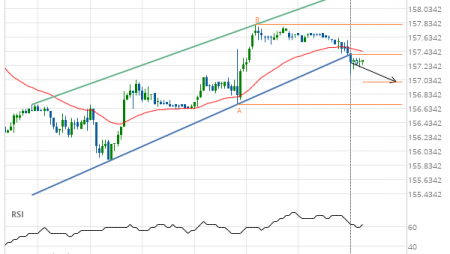
Gold Front Month up to 1794.4359
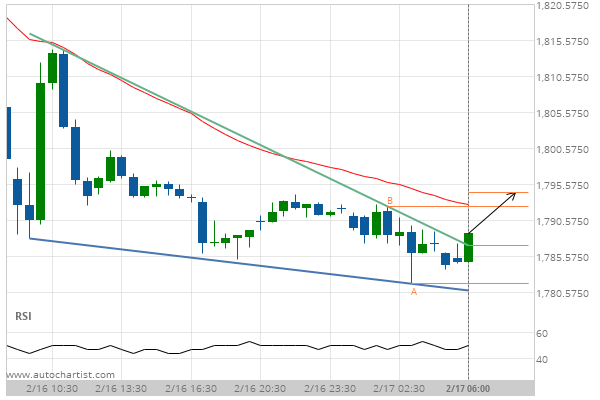
Falling Wedge has broken through the resistance line at 17-Feb-2021 06:00 EST. Possible bullish price movement forecast for the next 6 hours towards 1794.4359.
Falling Wedge has broken through the resistance line at 17-Feb-2021 06:00 EST. Possible bullish price movement forecast for the next 6 hours towards 1794.4359.