Help & Documentation
  • Home
  • Sign In
  • Contact Us
  • Home
  • Sign In
  • Contact Us

Gold Front Month up to 1768.0000

/Futures Technical Analysis - TD/Gold Front Month up to 1768.0000

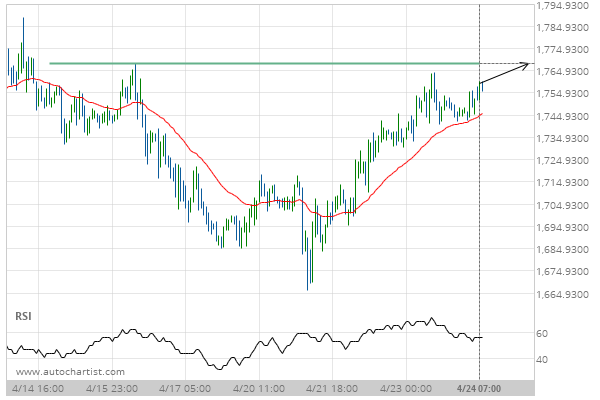
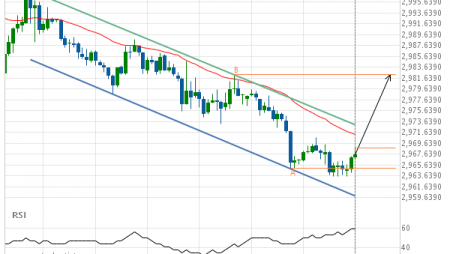
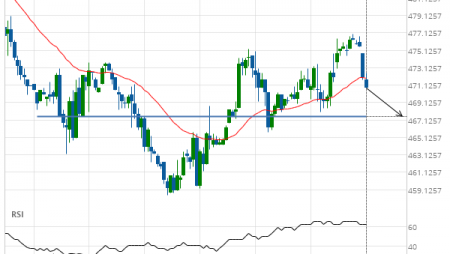
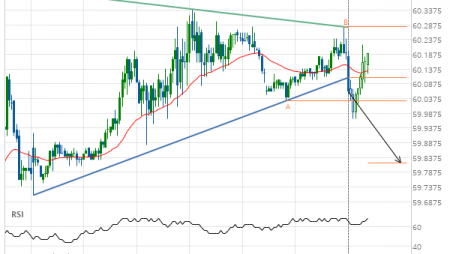
Gold Front Month up to 1768.0000

Posted on April 24, 2020 by Autochartist wrote in Futures Technical Analysis - TD.

Approaching Resistance level of 1768.0000 identified at 24-Apr-2020 07:00 EDT

Tags: GC
0 Likes
657 Views

You may also like

Lean Hogs down to 60.9462
November 12, 2020
Soybeans up to 851.9250
April 22, 2020
KC HRW Wheat down to 507.5000
January 25, 2019

Comments are closed.

US T-Bond down to 180.5625 Silver Front Month up to 15.7200

Futures Technical Analysis – TD

Light Sweet Crude Oil Front Month up to 67.9800

March 9, 2021 11:17 am | By Autochartist

Rising Wedge identified at 09-Mar-2021 05:00 EST. This pattern is... Read more →

Feeder Cattle Front Month down to 137.2250

March 9, 2021 11:17 am | By Autochartist

Channel Down identified at 08-Mar-2021 14:00 EST. This pattern is... Read more →

Soybean Oil up to 53.2300

March 9, 2021 11:17 am | By Autochartist

Channel Up identified at 09-Mar-2021 04:30 EST. This pattern is... Read more →

Silver Front Month up to 26.5600

March 9, 2021 11:17 am | By Autochartist

Approaching Resistance level of 26.5600 identified at 09-Mar-2021 04:00 EST Read more →

10 year T-Note up to 133.1644

March 9, 2021 11:17 am | By Autochartist

Falling Wedge has broken through the resistance line at 09-Mar-2021... Read more →

  • About Us
  • Privacy Policy
  • Disclaimer
  • Terms and Conditions
  • Get started for FREE
  • Contact Us
Copyright © 2022 Autochartist.com. All rights reserved.
This site uses cookies: Find out more.